Understanding Hypothesis Testing
In the realm of statistical analysis, hypothesis testing stands as a pivotal method for drawing meaningful inferences from data. It’s a process that involves devising a conjecture about a population, testing it against empirical evidence, and ultimately making a decision about its plausibility.

Key Elements of a Hypothesis Test
A hypothesis test is meticulously crafted around four fundamental components:
- Null Hypothesis (H0): This represents the initial assumption that there is no significant difference or relationship between the variables being investigated.
- Alternative Hypothesis (Ha): This posits the antithesis of the null hypothesis, suggesting that a meaningful difference or relationship does exist.
- Significance Level (α): A pre-determined threshold that defines the probability of rejecting the null hypothesis when it is actually true (Type I error).
- Test Statistic: A numerical measure that quantifies the discrepancy between the observed data and the null hypothesis.
Steps Involved in Hypothesis Testing
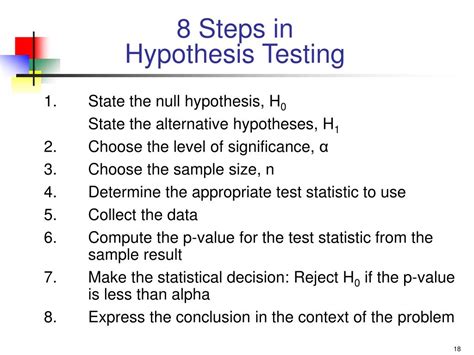
The process unfolds in a meticulous sequence of steps:
- Formulate Hypotheses: Clearly articulate the null and alternative hypotheses.
- Set Significance Level: Establish the acceptable margin of error (usually 0.05 or 0.01).
- Collect Data: Gather relevant data from the population or sample.
- Calculate Test Statistic: Employ appropriate statistical techniques to compute the test statistic.
- Compare to Significance Level: Determine if the test statistic exceeds the significance level.
- Make Decision: Reject the null hypothesis if the test statistic is significant; otherwise, fail to reject it.
- Interpret Results: Conclude whether the data supports the alternative hypothesis or provides insufficient evidence.
Types of Hypothesis Tests
- One-Sample Test: Compares a sample to a known population parameter.
- Two-Sample Test: Compares two samples to each other.
- Chi-Square Test: Assesses the relationship between categorical variables.
- ANOVA (Analysis of Variance): Compares the means of multiple groups.
Applications of Hypothesis Testing
Hypothesis testing finds myriad applications in diverse fields, including:
- Medical research: Determining the effectiveness of new treatments.
- Social sciences: Analyzing relationships between socioeconomic factors.
- Manufacturing: Evaluating the quality of products.
- Business: Making informed decisions based on data.
- Choose an appropriate statistical test: Ensure the test aligns with the data type and research question.
- Use a large sample size: Larger samples yield more accurate results.
- Control for confounders: Identify and eliminate factors that could bias the results.
- Replicate studies: Repeat the hypothesis test with different data or samples to enhance confidence in the conclusions.
Pros
- Provides objective evidence: Supports or refutes claims based on data.
- Quantifies uncertainty: Calculates the probability of making an incorrect decision.
- Statistical rigor: Adheres to well-defined statistical principles.
Cons
- Can be sensitive to sample size: Larger samples may yield significant results that are not meaningful.
- Type I and Type II errors: False positives and false negatives can occur.
- Assumptions may not always be met: Tests rely on assumptions about the population and data.
Tables for Reference
| Type of Hypothesis Test | Purpose |
|---|---|
| One-Sample Test | Compares a sample to a known population parameter |
| Two-Sample Test | Compares two samples to each other |
| Chi-Square Test | Assesses the relationship between categorical variables |
| ANOVA (Analysis of Variance) | Compares the means of multiple groups |
| Significance Level | Probability of Type I Error |
|---|---|
| 0.05 | 5% |
| 0.01 | 1% |
| 0.001 | 0.1% |
| Types of Errors | Description |
|---|---|
| Type I Error (False Positive) | Rejecting the null hypothesis when it is true |
| Type II Error (False Negative) | Failing to reject the null hypothesis when it is false |
| Assumptions of Hypothesis Testing | Conditions |
|---|---|
| Independence: Observations are independent of each other | |
| Normality: Data is normally distributed | |
| Homogeneity of Variances: Variances of different groups are equal |
Data Augmentation: Enhance data analysis by combining data from multiple sources or applying data mining techniques.
Conclusion
Hypothesis testing empowers researchers with a structured approach to validate or refute claims based on empirical evidence. By understanding its components, steps, and limitations, researchers can effectively leverage hypothesis testing to advance their investigations and derive meaningful insights.
