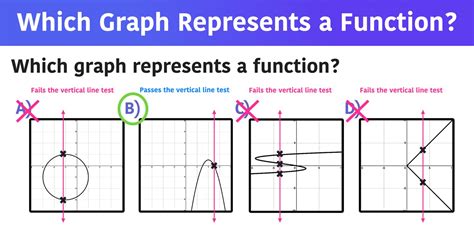
In mathematics, functions are represented by equations. These equations can be used to graph the function and determine its properties.

A graphed function is a graphical representation of a function. It shows the relationship between the independent variable (x-axis) and the dependent variable (y-axis).
Determining the Equation from a Graph
To determine the equation that represents a graphed function, we can use the following steps:
1. Identify the Type of Function
The first step is to identify the type of function that is being graphed. Common types of functions include linear, quadratic, exponential, and logarithmic functions. Each type of function has a characteristic shape that can help us identify it.
2. Determine the Slope and Intercept (for Linear Functions)
If the graph is a straight line, it is a linear function. To determine the equation of a linear function, we need to find its slope and y-intercept. The slope is the ratio of the change in y to the change in x. The y-intercept is the value of y when x is 0.
3. Determine the Vertex (for Quadratic Functions)
If the graph is a parabola, it is a quadratic function. The vertex of a quadratic function is the point at which the graph changes direction. To determine the equation of a quadratic function, we need to find the vertex and use the vertex form of the equation.
4. Determine the Domain and Range
The domain of a function is the set of all possible x-values. The range of a function is the set of all possible y-values. The domain and range of a function can help us determine the equation that represents the function.
Equation of a Graphed Function
Once we have identified the type of function, determined its key features, and found its domain and range, we can use the following equations to represent the graphed function:
- Linear function: y = mx + b, where m is the slope and b is the y-intercept.
- Quadratic function: y = ax^2 + bx + c, where a, b, and c are constants.
- Exponential function: y = a^x, where a is a constant.
- Logarithmic function: y = log_a(x), where a is a constant.
Real-World Applications
Functions are used in a wide variety of real-world applications, such as:
- Modeling population growth
- Forecasting sales trends
- Optimizing investment strategies
- Designing bridges and buildings
- Developing new medical treatments
Benefits of Graphing Functions
- Visualize the relationship between variables
- Identify key features of the function
- Make predictions and draw conclusions
- Solve problems and make decisions
Conclusion
Graphing functions is an essential tool for understanding and using functions. By following the steps outlined in this article, we can determine the equation that represents a graphed function and use that equation to solve problems and make decisions.
Additional Resources
Keywords
- Graphing functions
- Equation of a graph
- Linear function
- Quadratic function
- Exponential function
- Logarithmic function
- Real-world applications
- Benefits of graphing functions
