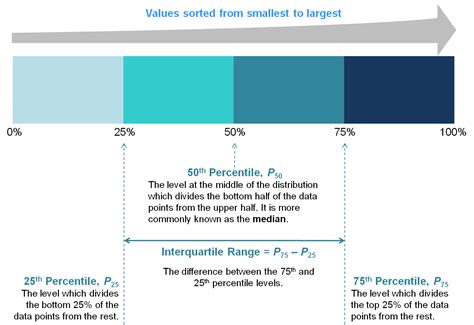
The 75th percentile is a statistical measure that represents the value at or below which 75% of the data in a distribution falls. It is also known as the upper quartile. The 75th percentile is often used to compare data sets or to identify outliers.

How to Calculate the 75th Percentile
There are several ways to calculate the 75th percentile. One method is to use the cumulative frequency distribution. To do this, first sort the data in ascending order. Then, find the cumulative frequency for each data point. The cumulative frequency is the number of data points that are less than or equal to the given data point.
Once you have the cumulative frequency distribution, find the value that corresponds to the 75th percentile. This value will be the 75th percentile.
For example, suppose you have the following data set:
10, 12, 15, 18, 20, 22, 25, 28, 30
The cumulative frequency distribution for this data set is as follows:
Data point | Cumulative frequency
10 | 1
12 | 2
15 | 3
18 | 4
20 | 5
22 | 6
25 | 7
28 | 8
30 | 9
The 75th percentile is the value that corresponds to the 75th cumulative frequency. In this case, the 75th cumulative frequency is 7. Therefore, the 75th percentile is 25.
Applications of the 75th Percentile
The 75th percentile has a variety of applications, including:
- Data analysis: The 75th percentile can be used to compare data sets or to identify outliers. For example, a company might use the 75th percentile to compare the sales of two different products.
- Risk assessment: The 75th percentile can be used to assess the risk of an event occurring. For example, an insurance company might use the 75th percentile to assess the risk of a customer filing a claim.
- Quality control: The 75th percentile can be used to monitor the quality of a product or service. For example, a manufacturer might use the 75th percentile to track the number of defects in a product.
Conclusion
The 75th percentile is a statistical measure that represents the value at or below which 75% of the data in a distribution falls. It is often used to compare data sets or to identify outliers. The 75th percentile has a variety of applications, including data analysis, risk assessment, and quality control.