The University of Tennessee (UT) is a vibrant and diverse academic community located in Knoxville, Tennessee. With over 30,000 students enrolled across its undergraduate and graduate programs, UT is a major educational institution in the Southeastern United States. The university’s demographics reflect the rich tapestry of the region and its commitment to inclusivity.

Student Body Demographics
1. Enrollment:
As of Fall 2022, UT had an enrollment of 30,524 students, making it the second-largest university in Tennessee.
2. Gender:
Female students constitute the majority of the student body, representing 57% of the total enrollment.
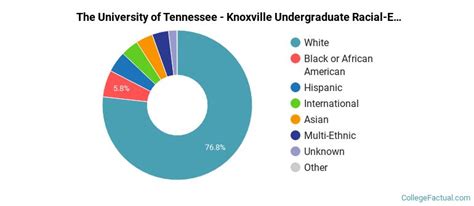
3. Ethnicity:
White students comprise the largest ethnic group at UT, accounting for 79% of the student population. Other ethnic groups include Black or African American (8%), Hispanic or Latino (5%), Asian (4%), and Native American or Alaska Native (0.6%).
4. Age:
The average age of undergraduate students at UT is 20 years old, while the average age of graduate students is 26 years old.
Faculty Demographics
1. Number of Faculty:
UT employs approximately 1,700 full-time faculty members.
2. Gender:
Male faculty members slightly outnumber female faculty members, with a ratio of 53% to 47%.
3. Ethnicity:
White faculty members represent the majority (76%), followed by Asian (12%), Black or African American (7%), Hispanic or Latino (2%), and Native American or Alaska Native (0.5%).
4. Degree Attainment:
The vast majority of UT faculty members hold a doctoral degree (85%), while 13% hold a master’s degree and 2% hold a bachelor’s degree.
Staff Demographics
1. Number of Staff:
UT employs approximately 4,000 staff members.
2. Gender:
Female staff members outnumber male staff members, with a ratio of 60% to 40%.
3. Ethnicity:
White staff members represent the majority (75%), followed by Black or African American (12%), Hispanic or Latino (4%), Asian (3%), and Native American or Alaska Native (0.5%).
Economic Impact of UT
UT has a significant economic impact on the state of Tennessee. According to a 2019 study by the University of Tennessee Center for Business and Economic Research, UT generates an estimated \$1.5 billion in annual economic output for the state. The university also supports over 10,000 jobs in Tennessee.
UT’s Commitment to Diversity and Inclusion
UT is committed to creating and maintaining a welcoming and inclusive campus environment for all students, faculty, and staff. The university has a number of initiatives in place to promote diversity and inclusion, including:
- The Office of Diversity and Engagement
- The Center for the Study of Black Culture and History
- The Pride Center for the LGBTQ+ Community
- The Women’s Empowerment and Advocacy Center
Conclusion
The University of Tennessee is a diverse and dynamic academic community that is committed to equity and inclusion. The university’s demographics reflect the rich tapestry of the region and its commitment to providing a comprehensive and engaging educational experience for all students. UT’s economic impact and its commitment to diversity make it a valuable asset to the state of Tennessee.