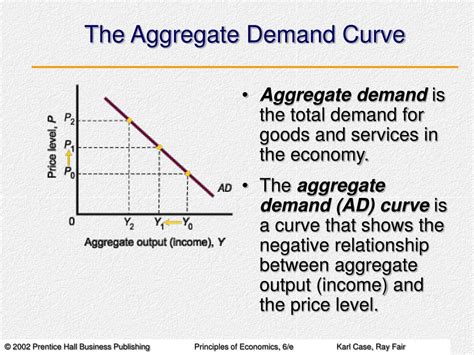
The aggregate demand (AD) curve is a graphical representation of the relationship between the overall price level in an economy and the quantity of real output demanded. It slopes downward, indicating that as the price level increases, the quantity of output demanded decreases, and vice versa.

Key Components of the AD Curve
The AD curve is determined by several key components:
- Consumption: Consumer spending, which accounts for about two-thirds of total AD.
- Investment: Business spending on new capital goods.
- Government spending: Spending by government entities, which can be a source of AD or a drain.
- Net exports: Exports minus imports, which represent the demand for domestic goods and services from abroad.
How the AD Curve Shifts
The AD curve can shift to the right (increase) or left (decrease) due to changes in any of its components. For example, an increase in consumer confidence, interest rate cuts that stimulate investment, or fiscal stimulus by the government can all lead to a rightward shift in the AD curve. Conversely, factors such as economic recession, rising interest rates, or a decrease in government spending can shift the AD curve to the left.
Applications of the AD Curve
The AD curve is a valuable tool for policymakers and economists. It allows them to:
- Forecast economic activity: By analyzing the AD curve, economists can predict changes in output, employment, and inflation.
- Design economic policies: The AD curve can help policymakers determine appropriate monetary and fiscal policies to stabilize the economy.
- Identify economic imbalances: An AD curve that is too far to the right or left can indicate economic imbalances, such as inflation or recession.
Common Mistakes to Avoid
When working with the AD curve, it is important to avoid common mistakes, such as:
- Ignoring the impact of supply: The AD curve only shows the demand side of the equation. To fully understand economic outcomes, it is also necessary to consider the supply side.
- Assuming the AD curve is static: The AD curve can shift over time due to changes in economic factors.
- Confusing the AD curve with other economic relationships: The AD curve is distinct from concepts such as the Phillips curve and the Laffer curve.
Step-by-Step Approach
To analyze the AD curve, follow these steps:
- Plot the AD curve on a graph, with the price level on the vertical axis and the quantity of output on the horizontal axis.
- Identify the key components of the AD curve (consumption, investment, government spending, and net exports).
- Consider factors that may shift the AD curve to the right or left.
- Use the AD curve to forecast economic activity and design appropriate economic policies.
Why the AD Curve Matters
The AD curve matters because it provides a framework for understanding the relationship between price level and output. It helps policymakers and economists make informed decisions about economic policy, ensuring economic stability and growth.
Benefits of Using the AD Curve
Analyzing the AD curve offers numerous benefits:
- Improved economic forecasting: The AD curve enables economists to predict economic conditions more accurately.
- Enhanced policymaking: The AD curve helps policymakers tailor economic policies to address specific economic challenges.
- Identification of economic imbalances: The AD curve can highlight economic imbalances, allowing for timely interventions.
- Greater understanding of economic relationships: Analyzing the AD curve deepens our understanding of how the economy functions.
Tables
| Component | Contribution to AD |
|---|---|
| Consumption | 68% |
| Investment | 16% |
| Government spending | 12% |
| Net exports | 4% |
| Factor | Effect on AD Curve |
|---|---|
| Increase in consumer confidence | Rightward shift |
| Interest rate cuts | Rightward shift |
| Fiscal stimulus by government | Rightward shift |
| Economic recession | Leftward shift |
| Rising interest rates | Leftward shift |
| Decrease in government spending | Leftward shift |