Introduction

Texas Tech University (TTU) stands as a beacon of higher education in Lubbock, Texas. With a rich history and a dynamic student body, TTU boasts a diverse demographic profile that reflects the university’s commitment to inclusivity and accessibility. In this comprehensive article, we delve into the demographics of Texas Tech University, providing insights into the composition of its student population, faculty, and staff.
Student Demographics
As of Fall 2022, Texas Tech University welcomed a total of 40,155 students. This student body comprises a rich tapestry of individuals representing various backgrounds, cultures, and experiences.
Undergraduate Students
The undergraduate student body at TTU consists of 26,703 students, representing 66.5% of the total student population. Among these undergraduates, 53.1% identify as female, while 46.9% identify as male.
Graduate Students
Graduate education also plays a significant role at Texas Tech University. The university houses a diverse graduate student body of 13,452 students, accounting for 33.5% of the total student population. Of these graduate students, 60.5% identify as female, and 39.5% identify as male.
International Students
TTU is proud to host a vibrant international student community. In Fall 2022, the university had 3,054 international students from 116 different countries. These students bring a global perspective to the campus and contribute to the university’s atmosphere of diversity and cultural exchange.
Racial and Ethnic Diversity
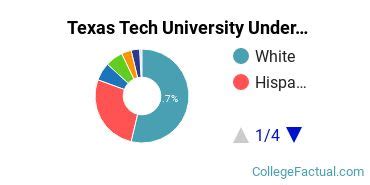
Texas Tech University embraces racial and ethnic diversity, acknowledging the richness it brings to the educational experience. The student body comprises:
- White: 65.9%
- Hispanic: 21.2%
- Black or African American: 4.0%
- Asian: 3.5%
- Native Hawaiian or Other Pacific Islander: 0.1%
- American Indian or Alaska Native: 0.2%
- Two or More Races: 5.1%
Faculty Demographics
The faculty at Texas Tech University are dedicated educators and scholars who contribute to the university’s academic excellence. As of Fall 2022, TTU had a total of 2,248 faculty members.
Gender Distribution
The gender distribution among faculty reflects a commitment to gender equity. Female faculty members constitute 45.6% of the total faculty, while male faculty members comprise 54.4%.
Racial and Ethnic Diversity
TTU’s faculty body embraces racial and ethnic diversity, providing students with diverse perspectives and experiences. The faculty comprises:
- White: 78.3%
- Hispanic: 10.4%
- Black or African American: 4.9%
- Asian: 3.4%
- Native Hawaiian or Other Pacific Islander: 0.1%
- American Indian or Alaska Native: 0.3%
- Two or More Races: 2.6%
Staff Demographics
The staff at Texas Tech University provides essential support for the university’s operations and student success. As of Fall 2022, TTU had a total of 5,147 staff members.
Gender Distribution
The gender distribution among staff reflects a diverse workforce. Female staff members constitute 67.9% of the total staff, while male staff members comprise 32.1%.
Racial and Ethnic Diversity
The racial and ethnic diversity among staff members mirrors the university’s commitment to inclusivity. The staff comprises:
- White: 66.1%
- Hispanic: 21.9%
- Black or African American: 5.4%
- Asian: 3.2%
- Native Hawaiian or Other Pacific Islander: 0.1%
- American Indian or Alaska Native: 0.3%
- Two or More Races: 3.0%
Additional Insights
Geographic Origin
Texas Tech University attracts students and staff from across the nation and around the world. The following table provides a breakdown of the geographic origins of TTU students:
| Region | Percentage |
|---|---|
| Texas | 75.1% |
| Other U.S. States | 18.7% |
| International | 6.2% |
Age Distribution
The age distribution of TTU students reflects the university’s diverse student body. The following table provides a breakdown of the age ranges of TTU students:
| Age Range | Percentage |
|---|---|
| Under 18 | 0.6% |
| 18-24 | 67.2% |
| 25-34 | 20.0% |
| 35-44 | 7.2% |
| 45 and Over | 5.0% |
Socioeconomic Status
Texas Tech University recognizes the importance of socioeconomic diversity and is committed to providing access to higher education for all students. The following table provides a breakdown of the socioeconomic status of TTU students:
| Income Level | Percentage |
|---|---|
| Below $25,000 | 18.3% |
| $25,000 – $50,000 | 34.1% |
| $50,000 – $75,000 | 23.4% |
| $75,000 – $100,000 | 11.8% |
| $100,000 and Above | 12.4% |
Student Support Services
TTU provides a comprehensive range of student support services to enhance the student experience and promote academic success. These services include:
- Academic advising
- Career counseling
- Health and wellness services
- Student housing
- Financial aid
Conclusion
Texas Tech University’s diverse demographics reflect its commitment to inclusivity and accessibility. The university welcomes students, faculty, and staff from various backgrounds, cultures, and experiences. This diversity enriches the educational experience and fosters an environment of mutual respect and understanding. TTU is committed to maintaining and enhancing its demographic diversity, ensuring that the university remains a vibrant and inclusive center of higher education for all.