Introduction

In any market, understanding the intricate relationship between supply and demand is crucial for businesses to make informed decisions. Market imbalances, either in the form of shortages or surpluses, can significantly impact prices, availability, and consumer behavior. This article delves into the concept of shortage or surplus graphs, empowering businesses with a valuable tool to analyze market conditions and forecast future trends.
Understanding Shortage and Surplus Graphs
A shortage or surplus graph visually depicts the relationship between the quantity supplied and the quantity demanded at various price levels. The point where the quantity supplied equals the quantity demanded represents market equilibrium.
- Shortage: When the quantity supplied falls below the quantity demanded, a shortage occurs. At a given price, consumers are willing to buy more than producers are willing to provide.
- Surplus: When the quantity supplied exceeds the quantity demanded, a surplus occurs. At a given price, producers are willing to provide more than consumers are willing to buy.
Graphical Representation
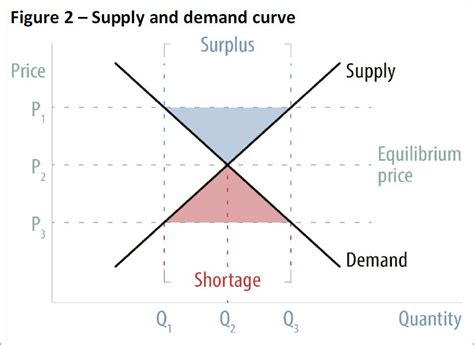
The following graph illustrates a typical shortage or surplus scenario:
[Image of a shortage or surplus graph]
In the above graph, the equilibrium point occurs at point E, where the blue supply curve (S) intersects the red demand curve (D).
- To the left of point E, a shortage exists (shaded blue area).
- To the right of point E, a surplus exists (shaded red area).
Factors Influencing Supply and Demand
Numerous factors can influence the supply and demand of goods and services, including:
Demand:
* Consumer preferences
* Income levels
* Population growth
* Technological advancements
Supply:
* Production costs
* Availability of raw materials
* Technology
* Government regulations
Applications of Shortage or Surplus Graphs
Shortage or surplus graphs have wide-ranging applications in various business and economic contexts:
- Market forecasting: By analyzing historical trends and current market conditions, businesses can use shortage or surplus graphs to predict future supply and demand.
- Pricing strategies: Businesses can optimize their pricing strategies by determining the price that balances supply and demand, thereby maximizing revenue and avoiding shortages or surpluses.
- Inventory management: Businesses can use these graphs to determine optimal inventory levels, reducing the risk of stockouts or excess inventory.
- Government policy: Governments rely on shortage or surplus graphs to guide economic policy decisions, such as production quotas or subsidies.
Tips and Tricks for Analyzing Shortage or Surplus Graphs
- Focus on the equilibrium point: Identify the point where supply and demand intersect, as this represents market equilibrium.
- Consider the elasticity of supply and demand: The steeper the supply or demand curve, the less elastic it is, indicating that a change in price will have a smaller impact on the quantity supplied or demanded.
- Examine the intersection of multiple curves: If multiple supply or demand curves intersect, there may be multiple equilibrium points, suggesting that market conditions can change rapidly.
- Analyze historical trends: By comparing graphs over time, businesses can identify patterns and anticipate future market fluctuations.
Conclusion
Shortage or surplus graphs provide a powerful tool for understanding supply and demand dynamics. By analyzing these graphs, businesses and policymakers can make informed decisions that optimize market efficiency, prevent market imbalances, and respond effectively to changing market conditions. A thorough understanding of shortage and surplus graphs is essential for success in a competitive and ever-evolving business landscape.
Additional Resources
- The Economics of Supply and Demand
- Shortage and Surplus: A Graphical Analysis
- Using Supply and Demand Curves to Forecast Prices
Tables
| Type | Description |
|---|---|
| Supply Demand Table | This table provides specific examples of factors that can influence supply and demand. |
| Historical Data Table | This table shows historical data on supply and demand for a particular product or service. |
| Forecast Table | This table provides a forecast of supply and demand for a particular product or service. |
| Government Policy Table | This table provides a summary of government policies that can impact supply and demand. |
Questions for Customers
- Have you ever experienced a shortage or surplus of a product or service?
- How did the shortage or surplus affect your buying behavior?
- What do you think are the causes of shortages or surpluses?
- What do you think businesses and governments should do to prevent shortages or surpluses?
Pain Points
-
Businesses:
- Lost sales due to shortages
- Excess inventory costs due to surpluses
-
Customers:
- Inconvenience caused by shortages
- Higher prices due to surpluses
Motivations
-
Businesses:
- Optimize revenue
- Reduce costs
-
Customers:
- Obtain products and services at a fair price
- Experience convenience in purchasing