Introduction

The population pyramid, also known as an age-sex pyramid, is a graphical representation that depicts the age and sex distribution of a population at a specific time. It is commonly used in AP Human Geography to analyze population dynamics and make inferences about the future of a society.
Definition
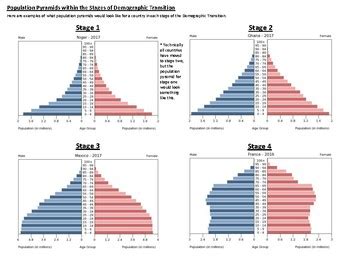
A population pyramid is a two-dimensional graph with horizontal bars representing age groups and vertical bars representing the number of individuals in each age group. The pyramid shape is created by the declining number of individuals as they age.
Components of a Population Pyramid
1. Age Groups:
The population pyramid is typically divided into five-year or ten-year age groups, starting from the youngest age group at the bottom of the pyramid to the oldest age group at the top.
2. Sex:
The pyramid is further divided into two halves, with the male population represented on the left side and the female population represented on the right side.
Applications of Population Pyramids in AP Human Geography
Population pyramids provide valuable insights into the current and future characteristics of a population, including:
1. Age Structure:
The population pyramid reveals the age distribution of the population, indicating the proportion of individuals in each age group. This information is useful for assessing the dependency ratio, which reflects the number of individuals in working age relative to the number of individuals in dependent age groups.
2. Population Growth Patterns:
The shape of the population pyramid can indicate the growth patterns of a population. A broad base with a narrow top suggests a rapidly growing population, while a narrow base with a wide top suggests a slowing or declining population.
3. Fertility Rates:
Population pyramids can reveal changes in fertility rates over time. A decrease in the number of births in younger age groups can indicate a declining fertility rate, while an increase in the number of births suggests an increase in fertility.
4. Mortality Rates:
Population pyramids can also indicate changes in mortality rates. A steep decline in the number of individuals in older age groups suggests higher mortality rates, while a gradual decline indicates lower mortality rates.
5. Population Projections:
Population pyramids can be used to project future population trends based on current age and sex distributions. This information is valuable for planning social and economic policies.
Case Study: Japan’s Population Pyramid
Japan’s population pyramid has been a topic of concern for policymakers due to its rapidly aging population. The 2020 population pyramid shows a narrow base with a wide top, indicating a declining birth rate and an aging population. This has significant implications for the country’s workforce, healthcare system, and economic growth.
Benefits of Using Population Pyramids
- Visual Representation: Population pyramids provide a visual representation of population data, making it easy to see patterns and trends.
- Comparative Analysis: Population pyramids can be used to compare age and sex distributions across different countries or regions.
- Policy Planning: Population pyramids help inform policy decisions related to education, healthcare, retirement, and economic development.
Challenges in Using Population Pyramids
- Data Accuracy: The accuracy of population pyramids depends on the quality of data collection and recording.
- Complex Interpretation: Population pyramids require careful interpretation to avoid oversimplifying the complexities of population dynamics.
- Limited Forecasting: Population pyramids provide a snapshot of the age and sex distribution at a given time and cannot accurately predict future changes that may result from migration, mortality, or other factors.
Common Mistakes to Avoid
- Misinterpreting the Shape: Do not automatically assume that a broad base indicates a healthy population or that a narrow top indicates an unhealthy population.
- Ignoring Demographic Transitions: Population pyramids do not account for demographic transitions, which may alter the population structure over time.
- Using Outdated Data: Population pyramids should be based on the most recent data available to ensure accurate analysis.
Conclusion
Population pyramids are valuable tools in AP Human Geography for understanding the age and sex distribution of populations. They provide insights into current and future population dynamics and help policymakers plan for future social and economic needs. However, it is important to use population pyramids carefully, considering their limitations and challenges, to avoid making inaccurate assumptions.
