In statistics, the Poisson distribution and the binomial distribution are two of the most commonly used probability distributions. Both distributions describe the probability of a certain number of occurrences in a given interval of time or space, but they have different assumptions and applications.

Poisson Distribution
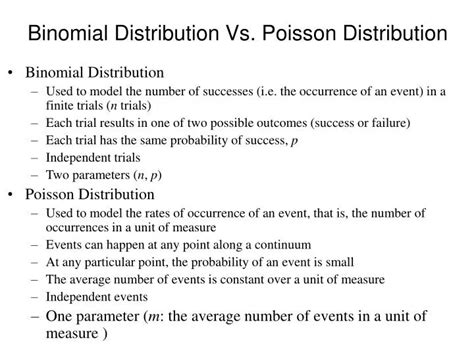
The Poisson distribution is a discrete probability distribution that describes the number of events that occur in a fixed interval of time or space. It is often used to model the number of phone calls received by a call center per hour, the number of defects in a manufactured product, or the number of goals scored in a soccer match.
The Poisson distribution is characterized by a single parameter, $\lambda$, which is the average number of events that occur in the interval. The probability of observing exactly $k$ events in the interval is given by the following formula:
$$P(X = k) = \frac{e^{-\lambda} \lambda^k}{k!}$$
where $e$ is the base of the natural logarithm.
Binomial Distribution
The binomial distribution is a discrete probability distribution that describes the number of successes in a sequence of independent experiments. It is often used to model the number of heads in a sequence of coin flips, the number of correct answers on a multiple-choice test, or the number of customers who visit a store on a given day.
The binomial distribution is characterized by two parameters, $n$ and $p$, which are the number of experiments and the probability of success on each experiment, respectively. The probability of observing exactly $k$ successes in $n$ experiments is given by the following formula:
$$P(X = k) = \binom{n}{k} p^k (1-p)^{n-k}$$
where $\binom{n}{k}$ is the binomial coefficient, which is given by the following formula:
$$\binom{n}{k} = \frac{n!}{k!(n-k)!}$$
Poisson Distribution vs. Binomial Distribution
The Poisson distribution and the binomial distribution are both used to model the number of events that occur in a given interval of time or space. However, there are some key differences between the two distributions.
| Feature | Poisson Distribution | Binomial Distribution |
|---|---|---|
| Number of events | Discrete | Discrete |
| Interval of time or space | Fixed | Fixed |
| Average number of events | $\lambda$ | $np$ |
| Probability of observing exactly $k$ events | $P(X = k) = \frac{e^{-\lambda} \lambda^k}{k!}$ | $P(X = k) = \binom{n}{k} p^k (1-p)^{n-k}$ |
When to Use Each Distribution
The Poisson distribution is appropriate to use when the following conditions are met:
- The number of events in the interval is approximately the same.
- The events are independent of each other.
- The average number of events is known.
The binomial distribution is appropriate to use when the following conditions are met:
- The number of independent experiments is fixed.
- The probability of success on each experiment is constant.
- The number of successes is approximately the same.
Applications
The Poisson distribution has a wide range of applications in various fields, including:
- Biology: Number of bacteria in a culture, number of mutations in a gene, number of accidents per day
- Business: Number of customers per hour, number of defects in a product, number of phone calls received by a call center
- Engineering: Number of failures of a machine, number of defects in a product, number of accidents per day
- Epidemiology: Number of cases of a disease, number of deaths from a disease, number of accidents per day
The binomial distribution also has a wide range of applications in various fields, including:
- Biology: Number of heads in a sequence of coin flips, number of correct answers on a multiple-choice test, number of mutations in a gene
- Business: Number of customers who visit a store on a given day, number of sales made by a salesperson, number of defective products in a batch
- Education: Number of students who pass a test, number of students who graduate from a school, number of students who score a certain grade on a test
- Engineering: Number of failures of a machine, number of defects in a product, number of accidents per day