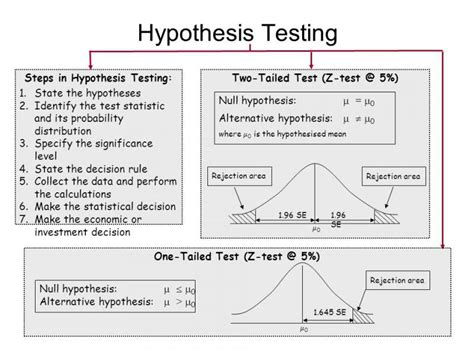
In the realm of data analysis, drawing accurate and meaningful conclusions is paramount. Statistical significance serves as a cornerstone in this endeavor, helping us determine whether the observed differences or relationships in our data are indeed real or merely due to chance. Neglecting to verify statistical significance can lead to erroneous conclusions and misinformed decision-making.

Understanding Statistical Significance
Statistical significance assesses the likelihood that a particular result could have occurred by random chance. It is expressed as a p-value, which represents the probability of obtaining a result as extreme as or more extreme than the one observed, assuming the null hypothesis is true (i.e., there is no real difference or relationship).
Typically, a p-value of less than 0.05 is considered statistically significant, indicating that the observed result is unlikely to have occurred by chance alone. However, it’s important to note that a p-value alone does not prove a hypothesis; it merely provides evidence against the null hypothesis.
Common Mistakes to Avoid
1. Ignoring Multiple Comparisons:
When conducting multiple statistical tests, the probability of obtaining a false positive (i.e., rejecting the null hypothesis when it is actually true) increases. To account for this, it’s crucial to adjust the significance level or use multiple comparison correction methods to maintain the overall probability of a Type I error.
2. Relying on P-Values Alone:
While p-values provide a measure of statistical significance, they should not be the sole basis for making conclusions. Other factors, such as the sample size, effect size, and prior knowledge, should also be considered.
3. Misinterpreting the Null Hypothesis:
The null hypothesis assumes no real difference or relationship exists. Rejecting the null hypothesis does not necessarily imply the existence of a meaningful effect; it simply means that the observed difference is unlikely to have occurred by chance.
4. Overstating Conclusions:
Avoid making overly strong statements based on statistically significant results. The p-value only indicates the likelihood of a chance occurrence, not the certainty of a relationship or effect.
Step-by-Step Approach to Ensure Correct Conclusions
1. Define Your Hypothesis:
Clearly state the research question or hypothesis you wish to test.
2. Collect Data:
Gather a representative and unbiased sample to ensure your data is reliable.
3. Choose Appropriate Statistical Test:
Select a statistical test that is suitable for the type of data and hypothesis being tested.
4. Conduct the Test:
Calculate the test statistic and p-value using the appropriate statistical formula or software.
5. Interpret the Results:
Determine whether the p-value is less than the pre-established significance level and consider the effect size and other relevant factors.
6. Draw Conclusions:
Based on the statistical significance and other considerations, draw conclusions about the research question or hypothesis.
Applications of Statistical Significance
Beyond scientific research, statistical significance has numerous practical applications:
- Market Research: Determining if there is a statistically significant difference in customer preferences for different products or services.
- Clinical Trials: Assessing the efficacy and safety of new drug treatments.
- Financial Analysis: Identifying statistically significant trends or correlations in financial data to guide investment decisions.
- Quality Control: Evaluating the consistency and reliability of manufactured products or processes.
Useful Tables
| Statistical Test | Description | Applications |
|---|---|---|
| t-Test | Compares the means of two independent groups | Clinical trials, social science research |
| ANOVA | Compares the means of multiple groups | Market research, experimental design |
| Pearson Correlation | Measures the linear relationship between two variables | Portfolio optimization, customer segmentation |
| Chi-Square Test | Assesses the independence of two categorical variables | Medical diagnosis, survey analysis |
Conclusion
Ensuring the correctness of your conclusions is paramount in data analysis. By understanding statistical significance and avoiding common mistakes, you can draw well-informed conclusions and make sound decisions based on your data. Remember to consider other relevant factors, such as sample size, effect size, and prior knowledge, and adopt a systematic approach to ensure the accuracy of your findings.
