Introduction
Pivot tables are a powerful data analysis tool that allow you to summarize, manipulate, and visualize large datasets. However, when working with dates, pivot tables often group them by default, which can make it difficult to analyze data over time. In this article, we will explore how to prevent pivot tables from grouping dates, unlocking new possibilities for data analysis.

Understanding Date Grouping
By default, when you create a pivot table with a date field, Excel will group the dates into bins, such as years, quarters, or months. This can be useful for certain types of analysis, but it can also be a hindrance when you want to view data on a more granular level.
Disabling Date Grouping
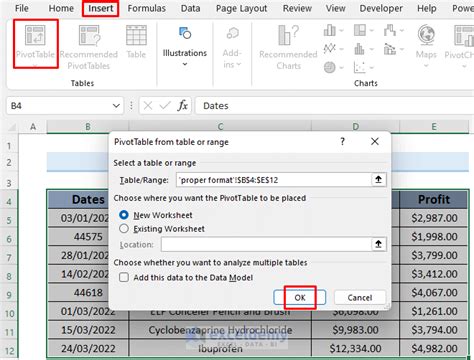
To disable date grouping in a pivot table, follow these steps:
- Select the pivot table.
- Go to the “Options” tab on the Ribbon.
- In the “PivotTable Options” section, uncheck the “Group dates by” checkbox.
Benefits of Ungrouped Dates
Ungrouping dates in a pivot table offers several benefits:
- Greater flexibility: Allows you to analyze data at any level of granularity, from days to years.
- Time-series analysis: Enables you to track changes in data over time without being constrained by pre-defined bins.
- Custom aggregations: Allows you to create custom aggregations, such as rolling averages or year-over-year calculations.
How to Leverage Ungrouped Dates
Once you have disabled date grouping, you can leverage ungrouped dates for a wide range of applications, including:
- Trend analysis: Identify trends over time by plotting data on a line chart or scatterplot.
- Seasonality analysis: Determine if there are any seasonal patterns in your data by comparing data from different months or seasons.
- Cohort analysis: Track the performance of different customer cohorts over time.
Innovate with Ungrouped Dates
By embracing the power of ungrouped dates, you can unlock new possibilities for data analysis. Consider these innovative applications:
- Web traffic analysis: Track website traffic by hour, day, or week to identify peak times and optimize your marketing strategies.
- Sales forecasting: Predict future sales by analyzing historical data at a granular level.
- Project management: Monitor project progress on a daily or weekly basis to identify bottlenecks and minimize delays.
Common Mistakes to Avoid
When working with ungrouped dates in pivot tables, there are a few common mistakes to avoid:
- Overloading the pivot table: Do not include too many fields in the pivot table, as this can make it difficult to read and understand.
- Incorrect data formatting: Ensure that your date field is formatted correctly (e.g., dd/mm/yyyy) to avoid errors in calculations.
- Ignoring outliers: Pay attention to outliers in your data, as they can skew the results of your analysis.
Conclusion
Pivot tables are a powerful tool for data analysis, but they can be limited when dates are grouped by default. By disabling date grouping, you can unlock new possibilities for data analysis and gain a deeper understanding of your data. By embracing the power of ungrouped dates, you can innovate and make better decisions based on your data.
Table 1: Benefits of Ungrouping Dates in Pivot Tables
| Benefit | Description |
|---|---|
| Greater flexibility | Allows analysis at any level of granularity |
| Time-series analysis | Enables tracking changes over time |
| Custom aggregations | Supports creation of unique calculations |
Table 2: Common Mistakes to Avoid When Working with Ungrouped Dates
| Mistake | Description |
|---|---|
| Overloading the pivot table | Including too many fields in the pivot table |
| Incorrect data formatting | Date field not formatted correctly |
| Ignoring outliers | Failing to consider outliers in data |
Table 3: Innovative Applications of Ungrouped Dates
| Application | Description |
|---|---|
| Web traffic analysis | Tracking website traffic at a granular level |
| Sales forecasting | Predicting future sales based on historical data |
| Project management | Monitoring project progress on a daily or weekly basis |
Table 4: Questions to Engage Customers
| Question | Purpose |
|---|---|
| What pain points are you facing when analyzing data with pivot tables? | Identify customer challenges |
| How would ungrouping dates help you overcome these challenges? | Validate customer needs |
| What innovative applications can you envision using ungrouped dates? | Generate ideas |
Call to Action
If you are ready to unlock the power of ungrouped dates in your pivot tables, follow the steps outlined in this article. By embracing this technique, you can gain deeper insights into your data and make better decisions for your business.