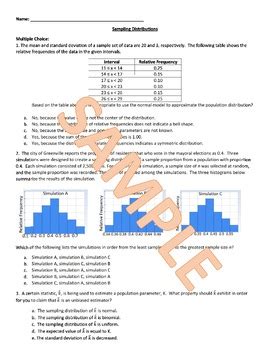
In this comprehensive lesson, we delve into the fundamental concepts of sampling distributions and standard error, essential components of statistical inference in AP Statistics. We will explore how these distributions provide a probabilistic framework for understanding the behavior of sample statistics and delve into the practical applications of these concepts in various fields.

Understanding Sampling Distributions
A sampling distribution is a probability distribution that describes the possible values of a sample statistic, such as the sample mean or sample proportion, obtained from all possible random samples of a given size from a population. The shape, center, and spread of a sampling distribution provide insights into the characteristics of the underlying population.
Central Limit Theorem
The Central Limit Theorem (CLT) is a fundamental theorem in statistics that states that the sampling distribution of sample means approaches a normal distribution as the sample size increases, regardless of the shape of the population distribution. This theorem has profound implications for statistical inference, as it allows us to make inferences about population parameters based on sample statistics.
Standard Error
The standard error is a measure of the spread of a sampling distribution. It represents the standard deviation of the sample statistic across all possible random samples of a given size. The standard error is inversely proportional to the square root of the sample size, meaning that larger sample sizes lead to smaller standard errors.
Applications of Sampling Distributions and Standard Error
Sampling distributions and standard error find wide applications in various disciplines, including:
- Population Estimation: Estimating population parameters, such as the population mean or proportion, using sample statistics and the standard error.
- Hypothesis Testing: Determining the probability of observing a sample statistic as extreme as or more extreme than the one obtained, assuming a null hypothesis about the population parameter.
- Confidence Intervals: Constructing confidence intervals for population parameters, providing a range of values within which the true parameter is likely to lie with a specified confidence level.
- Sample Size Determination: Determining the appropriate sample size to achieve a desired level of precision or confidence in estimation or hypothesis testing.
Tips and Tricks
- Visualize the Sampling Distribution: Graph the probability distribution of the sample statistic to understand its shape and center.
- Use the Standard Error to Estimate the Population Parameter: Multiply the sample statistic by two standard errors to obtain a 95% confidence interval for the population parameter.
- Increase Sample Size to Reduce Standard Error: A larger sample size results in a smaller standard error, leading to more precise estimates and narrower confidence intervals.
Common Mistakes to Avoid
- Confusing the Sample Mean with the Population Mean: The sample mean is a random variable that varies from sample to sample, whereas the population mean is a fixed parameter.
- Overreliance on Sample Statistics: A single sample statistic may not accurately represent the population parameter due to sampling variability.
- Ignoring the Standard Error: Failing to consider the standard error when making inferences about population parameters can lead to erroneous conclusions.
Step-by-Step Approach to Using Sampling Distributions and Standard Error
- Define the Population and Sample: Identify the population of interest and the random sample drawn from it.
- Calculate the Sample Statistic: Compute the sample mean, sample proportion, or other relevant sample statistic.
- Find the Standard Error: Determine the standard error of the sample statistic.
- Construct a Sampling Distribution: Sketch the probability distribution of the sample statistic, using the CLT if necessary.
- Make Inferences: Use the sampling distribution and standard error to draw inferences about the population parameter.
Conclusion
Sampling distributions and standard error are crucial concepts in statistical inference. By understanding their properties and applications, we can effectively estimate population parameters, test hypotheses, and construct confidence intervals. These concepts empower researchers and practitioners to make informed decisions based on data, advancing scientific knowledge and enhancing decision-making processes in various fields.
Tables
Table 1: Key Concepts
| Term | Definition |
|---|---|
| Sampling Distribution | Probability distribution of a sample statistic |
| Central Limit Theorem | Sampling distribution of sample means approximates normality for large sample sizes |
| Standard Error | Standard deviation of a sampling distribution |
Table 2: Applications
| Application | Description |
|---|---|
| Population Estimation | Estimating population parameters from sample statistics |
| Hypothesis Testing | Determining the probability of observing extreme sample statistics |
| Confidence Intervals | Constructing ranges of plausible values for population parameters |
| Sample Size Determination | Determining appropriate sample size for desired precision or confidence |
Table 3: Tips and Tricks
| Tip | Description |
|---|---|
| Visualize the Distribution | Graph the probability distribution of the sample statistic |
| Use Standard Error for Estimation | Multiply sample statistic by 2 standard errors for 95% confidence interval |
| Increase Sample Size | Larger sample sizes reduce standard error and increase precision |
Table 4: Common Mistakes
| Mistake | Description |
|---|---|
| Confusing Sample with Population Mean | Sample mean varies from sample to sample, while population mean is fixed |
| Overreliance on Sample Statistics | Single sample statistic may not accurately represent population |
| Ignoring Standard Error | Standard error is essential for making reliable inferences |
