Understanding Isoline Maps
An isoline map, also known as an isopleth map, is a type of thematic map that displays data using lines to connect points of equal value. The lines, called isolines, help visualize the distribution of a particular variable across a geographic area.

Isoline maps are widely used in AP Human Geography to analyze and present data related to population, climate, economic activity, and other demographic characteristics. They provide a clear and concise representation of the spatial distribution of data, making them valuable tools for identifying patterns, trends, and relationships.
Types of Isoline Maps
There are various types of isoline maps, each designed to display specific types of data:
- Contour lines represent the elevation of land surfaces and are used in topographic maps.
- Isobars connect points of equal atmospheric pressure and are used in weather maps.
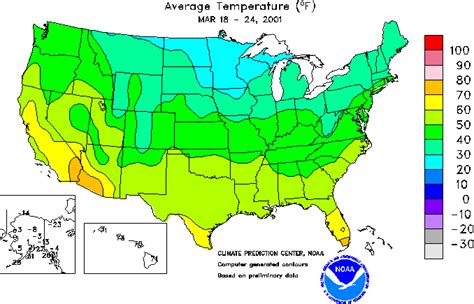
- Isotherms connect points of equal temperature and are used in climate maps.
- Isopleths connect points of equal quantitative values, such as population density or GDP per capita.
- Isolines of change show the change in a variable over time or space.
Applications of Isoline Maps in AP Human Geography
Isoline maps have wide-ranging applications in AP Human Geography, including:
Population Distribution
- Visualizing population density and distribution patterns
- Identifying areas of high and low population concentration
- Analyzing urban growth and rural-urban migration
Climate Analysis
- Mapping temperature and precipitation patterns
- Identifying climatic zones and regions
- Assessing climate change impacts
Economic Geography
- Representing GDP distribution and economic development patterns
- Identifying disparities in income and wealth
- Analyzing economic growth and decline
Environmental Analysis
- Mapping soil moisture and vegetation cover
- Identifying areas of environmental degradation
- Studying the impact of human activities on the environment
Example of an Isoline Map in AP Human Geography
Consider an isoline map of population density in the United States. The map shows lines connecting points of equal population density. Densely populated areas, such as metropolitan centers, are represented by closely spaced isolines, while sparsely populated areas are represented by widely spaced isolines.
This map allows geographers to visually analyze population distribution patterns, identify population concentrations, and understand the spatial distribution of human settlements.
Strategies for Using Isoline Maps in AP Human Geography
To effectively use isoline maps in AP Human Geography, consider the following strategies:
- Identify the variable being mapped: Determine what the isolines represent (e.g., population density, temperature).
- Examine the scale and scope of the map: Consider the geographic area and level of detail of the data.
- Interpret the isolines: Understand the spacing and values of the isolines to infer data patterns and trends.
- Identify patterns and anomalies: Look for areas of high or low values, clusters, and any deviations from expected patterns.
- Draw conclusions: Based on the analysis, make informed deductions about the spatial distribution of the variable and its implications.
Pain Points and Motivations for Using Isoline Maps
Pain Points
- Data collection and accuracy challenges
- Complexity of representing multiple variables on a single map
- Difficulty in interpreting isolines for non-expert users
Motivations
- Provides a clear and concise representation of data
- Facilitates spatial analysis and identification of patterns
- Supports decision-making and policy formulation
- Enhances understanding of geographic phenomena
FAQs on Isoline Maps in AP Human Geography
Q: What is the difference between an isoline map and a choropleth map?
A: Choropleth maps use shaded areas to represent data, while isoline maps use lines.
Q: How do I choose the appropriate isoline interval for my map?
A: Consider the range and distribution of the data to ensure that the isolines provide meaningful and interpretable information.
Q: Can isoline maps be used to compare multiple variables?
A: Yes, by overlaying multiple maps or using color-coded isolines to represent different variables.
Q: How can isoline maps contribute to geographical research?
A: They provide a foundation for quantitative analysis, identify spatial relationships, and support the development of models and theories.
Q: What are some challenges in using isoline maps?
A: Data availability, accuracy, and the need for skilled interpretation can be potential challenges.
Q: How can I effectively present isoline maps?
A: Use clear legends, labels, and annotations to ensure that the map is easy to understand and interpret.
Tables
Table 1: Examples of Isoline Maps in AP Human Geography
| Variable | Map Type |
|---|---|
| Population Density | Isopleth |
| Isobars | Pressure |
| Isotherms | Temperature |
| Soil Moisture | Isopleth |
| GDP per Capita | Isopleth |
Table 2: Advantages of Using Isoline Maps in AP Human Geography
| Advantage | Explanation |
|---|---|
| Visualize data distribution | Provides a clear representation of the spatial distribution of data. |
| Identify patterns and trends | Isolines help identify areas of high or low values, clusters, and changes over time. |
| Support decision-making | Maps can aid in decision-making by providing a visual representation of data and identifying areas of concern. |
| Enhance understanding | Isolines facilitate the comprehension of spatial relationships and the interconnectedness of geographical phenomena. |
Table 3: Applications of Isoline Maps in Urban Planning
| Application | Example |
|---|---|
| Population distribution planning | Identify areas of high and low population density, guiding urban development. |
| Transportation planning | Analyze accessibility to services and infrastructure based on population distribution. |
| Land use planning | Map land use patterns, identify areas for development and conservation. |
| Environmental planning | Assess environmental risks, such as flooding or pollution, based on elevation data. |
Table 4: Strategies for Using Isoline Maps Effectively
| Strategy | Explanation |
|---|---|
| Choose appropriate data | Select data that is relevant to the research question and accurately reflects the variable being mapped. |
| Determine scale and scope | Consider the geographic area and level of detail needed for the analysis. |
| Select isoline intervals | Establish intervals that provide meaningful and interpretable information. |
| Interpret patterns and anomalies | Analyze the spacing and values of isolines to identify patterns, trends, and deviations from expected values. |
| Draw conclusions | Based on the analysis, make informed deductions about the spatial distribution of the variable and its implications. |