In the world of finance, understanding investment demand is crucial for making informed decisions. The investment demand graph is a powerful tool that visually represents the relationship between the quantity of investment demanded and the interest rate. This graph provides valuable insights into market trends, enabling investors to identify potential investment opportunities and make strategic choices.

Understanding the Investment Demand Graph
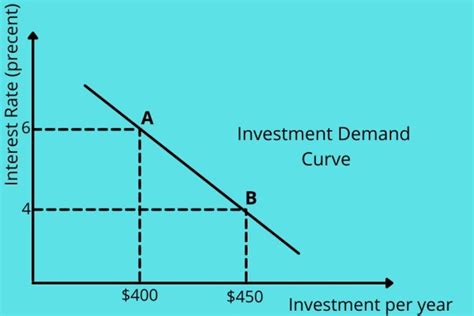
The investment demand graph typically plots the quantity of investment demanded on the y-axis and the interest rate on the x-axis. The downward-sloping nature of the graph indicates that as the interest rate rises, the quantity of investment demanded decreases. This inverse relationship arises because higher interest rates make borrowing more expensive, which discourages businesses and individuals from making investments.
Key Features of the Investment Demand Graph:
- The slope of the graph: A steeper slope indicates a more sensitive relationship between interest rates and investment demand.
- The interest rate elasticity of investment demand: This measures the responsiveness of investment demand to changes in interest rates. A higher elasticity indicates a greater sensitivity.
- The equilibrium point: This is the point where the quantity of investment supplied equals the quantity of investment demanded.
Shifts in the Investment Demand Graph
The investment demand graph can shift in various directions, indicating changes in market conditions. Key factors that can cause these shifts include:
- Technological advancements: Innovations that reduce production costs or enhance productivity can increase investment demand.
- Government policies: Favorable government policies, such as tax incentives or infrastructure spending, can stimulate investment.
- Investor sentiment: Changes in investor confidence can influence investment demand, leading to either increased or decreased investment activity.
- Economic conditions: Economic growth and stability can boost investment, while recessionary conditions can suppress it.
Benefits of Analyzing the Investment Demand Graph
Analyzing the investment demand graph offers numerous benefits for investors:
- Identify Potential Investment Opportunities: By understanding the relationship between interest rates and investment demand, investors can anticipate trends and capitalize on opportunities.
- Make Informed Investment Decisions: The graph helps investors determine the optimal amount of investment based on their risk tolerance and financial goals.
- Monitor Market Conditions: Tracking the shifts in the investment demand graph allows investors to stay abreast of changing market dynamics and adjust their investment strategies accordingly.
- Forecast Investment Trends: The graph can be used to predict future investment behavior, enabling investors to make proactive decisions.
Common Mistakes to Avoid When Using the Investment Demand Graph
To avoid inaccuracies in interpreting the investment demand graph, it’s essential to avoid common mistakes:
- Assuming a linear relationship: While the graph typically slopes downward, the relationship between interest rates and investment demand may not always be perfectly linear.
- Ignoring other factors: Various factors influence investment demand beyond interest rates, such as economic conditions and market sentiment.
- Overreliance on past trends: Historical data can be helpful, but it doesn’t guarantee future performance.
- Exaggerating the predictive power of the graph: The investment demand graph is a valuable tool, but its predictive capabilities are limited.
Effective Strategies for Using the Investment Demand Graph
To maximize the benefits of using the investment demand graph, consider these effective strategies:
- Combine with other market indicators: Analyze the graph in conjunction with other economic indicators to gain a more comprehensive understanding of market conditions.
- Consider both short-term and long-term trends: Monitor the graph over different time frames to identify short-term fluctuations and long-term patterns.
- Adjust investment portfolios accordingly: Use the insights gained from the graph to adjust investment portfolios and make strategic asset allocation decisions.
- Seek professional guidance: Consult with financial advisors or research analysts to gain expert insights and guidance on interpreting the investment demand graph.
Why Investment Demand Matters
Investment demand is a crucial factor in economic growth and financial market stability. It influences the availability of capital for businesses, supports job creation, and drives innovation. Adequate investment is essential for sustaining economic development and improving living standards.
Conclusion
The investment demand graph is a valuable tool for understanding market trends and making informed investment decisions. By analyzing the relationship between interest rates and investment demand, investors can identify potential opportunities, forecast trends, and adjust their strategies accordingly. However, it’s important to avoid common pitfalls and use the graph effectively to maximize its benefits. By incorporating the investment demand graph into their research and decision-making process, investors can enhance their financial performance and achieve their investment goals.
Useful Tables
Table 1: Factors Influencing Investment Demand
| Factor | Description |
|---|---|
| Interest rates | Cost of borrowing |
| Technological advancements | Productivity enhancements |
| Government policies | Tax incentives, infrastructure spending |
| Investor sentiment | Confidence in investment potential |
| Economic conditions | Growth, stability, recession |
Table 2: Benefits of Analyzing the Investment Demand Graph
| Benefit | Description |
|---|---|
| Identify investment opportunities | Anticipate trends |
| Make informed decisions | Determine optimal investment levels |
| Monitor market conditions | Track changing dynamics |
| Forecast investment trends | Predict future behavior |
Table 3: Common Mistakes to Avoid
| Mistake | Description |
|---|---|
| Assuming linear relationship | Relationship may not be perfectly linear |
| Ignoring other factors | Consider economic conditions, market sentiment |
| Overreliance on past trends | Past performance does not guarantee future results |
| Exaggerating predictive power | Use caution in predicting future trends |
Table 4: Effective Strategies
| Strategy | Description |
|---|---|
| Combine with other indicators | Gain a comprehensive market view |
| Consider short-term and long-term trends | Identify fluctuations and patterns |
| Adjust investment portfolios | Make strategic asset allocations |
| Seek professional guidance | Consult with experts for insights |