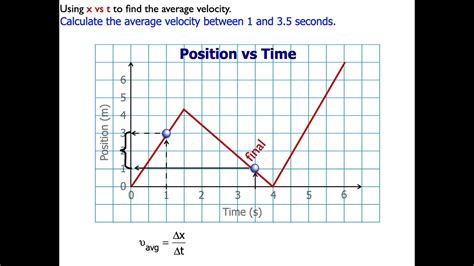
A velocity-time graph illustrates the relationship between an object’s velocity and time. It is a valuable tool for determining the average velocity of an object over a specific time interval. This article provides a comprehensive guide on how to calculate average velocity using a velocity-time graph.

Understanding Velocity-Time Graphs
A velocity-time graph is a graphical representation of an object’s velocity along the y-axis and time along the x-axis. The graph consists of a series of points connected by lines or curves. Each point on the graph represents the object’s velocity at a specific instant in time.
Calculating Average Velocity
The average velocity of an object over a given time interval is the total displacement of the object divided by the total time taken:
Average Velocity = (Displacement) / (Time)
Using a velocity-time graph, the average velocity can be calculated by determining the area under the curve between the initial and final points of the time interval. This area represents the total displacement of the object. The time interval is the difference between the initial and final time.
Step-by-Step Instructions
To calculate average velocity on a velocity-time graph:
- Identify the initial and final time points: Locate the points on the graph representing the start and end of the time interval of interest.
- Determine the displacement: Calculate the total displacement of the object by measuring the area under the curve between the initial and final time points. The units of displacement are typically meters (m) or kilometers (km).
- Calculate the time interval: Subtract the initial time from the final time to find the total time interval. The units of time are typically seconds (s) or hours (hr).
- Divide displacement by time: Divide the total displacement by the total time interval to obtain the average velocity. The units of average velocity are typically meters per second (m/s) or kilometers per hour (km/hr).
Example
Consider a velocity-time graph for an object moving with constant velocity. The graph shows a straight line with a positive slope. The initial time is 0 seconds and the final time is 5 seconds. The area under the curve is 50 meters.
Average Velocity = (Displacement) / (Time)
Average Velocity = 50 meters / 5 seconds
Average Velocity = 10 meters per second
Applications
Calculating average velocity on a velocity-time graph has numerous applications, including:
- Determining the average speed of a moving vehicle
- Analyzing the motion of projectiles
- Estimating the rate of change of an object’s position
Effective Strategies
- Use a consistent scale for both the velocity and time axes.
- Accurately measure the area under the curve using a ruler, planimeter, or software.
- Consider the sign of the velocity when calculating the displacement.
Tips and Tricks
- Divide the area under the curve into smaller rectangles to improve accuracy.
- Use a computer program or graphing calculator to automate the calculations.
- Ensure that the time interval used is appropriate for the application.
Common Mistakes to Avoid
- Using an inconsistent scale for the velocity and time axes.
- Measuring the area under the curve incorrectly.
- Neglecting the sign of the velocity.
- Choosing an inappropriate time interval.
Conclusion
Calculating average velocity on a velocity-time graph is a fundamental skill in physics and engineering. By following the steps outlined in this article, you can accurately determine the average velocity of an object over a specified time interval. This information is crucial for analyzing motion and understanding various physical phenomena.