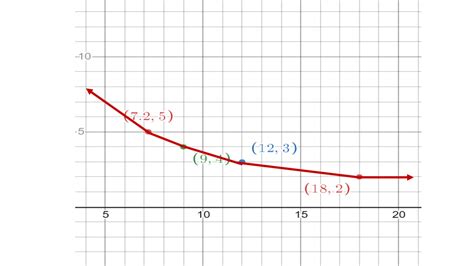
The graph of the equation y = 1/x is a hyperbola that opens to the left and right. It is the inverse of the linear equation y = x, and its shape is dictated by the inverse variation relationship between x and y.

Inverse Variation: The Mathematical Foundation
Inverse variation describes the relationship between two variables, x and y, where their product is constant. Mathematically, this is expressed as:
x * y = k
where k is a constant.
In the case of y = 1/x, the constant k is equal to 1. This means that as x increases, y decreases, and vice versa.
Properties of the Graph
The graph of y = 1/x exhibits several distinctive properties:
- Asymptotes: The lines y = 0 and x = 0 are asymptotes to the graph. This means that the graph approaches these lines but never intersects them.
- Center: The graph has a center at the origin (0, 0).
- Symmetry: The graph is symmetric about the x-axis.
- Quadrants: The graph lies in the first and third quadrants.
Applications of y = 1/x
The graph of y = 1/x finds applications in various fields, including:
- Inverse Proportions: Situations where the product of two quantities remains constant, such as the relationship between the speed of a moving object and the time it takes to travel a certain distance.
- Resistor Networks: In electrical circuits, the relationship between the resistance of a resistor and the current flowing through it follows an inverse variation pattern.
- Dilution Problems: In chemistry, the concentration of a solution varies inversely with the volume of solvent added.
Step-by-Step Approach to Graphing y = 1/x
To graph y = 1/x, follow these steps:
- Plot the Center: Plot the origin (0, 0) as the center of the graph.
- Draw the Asymptotes: Draw the lines y = 0 and x = 0 as the asymptotes.
- Choose Points: Select several points on the graph, such as (1, 1), (2, 1/2), and (3, 1/3).
- Plot the Points: Plot the selected points on the graph.
- Draw the Curve: Connect the plotted points using a smooth curve that approaches the asymptotes.
Common Mistakes to Avoid
- Forgetting the Center: Remember to plot the origin as the center of the graph.
- Ignoring the Asymptotes: Ensure that the graph approaches the asymptotes but does not intersect them.
- Miscalculating Points: Double-check the calculations while selecting points for plotting.
Effective Strategies for Graphing y = 1/x
- Use a Table: Create a table of values for x and y to help visualize the relationship.
- Draw a Coordinate System: Accurately draw the axes and label them appropriately.
- Use Technology: Consider using graphing software or online tools for a precise graph.
Tables for Analysis
Table 1: Points on the Graph of y = 1/x
| x | y |
|---|---|
| -3 | -1/3 |
| -2 | -1/2 |
| -1 | -1 |
| 0 | Undefined |
| 1 | 1 |
| 2 | 1/2 |
| 3 | 1/3 |
Table 2: Inverse Proportions
| Quantity 1 | Quantity 2 |
|---|---|
| Speed of object | Time taken to travel a distance |
| Current flowing through a resistor | Resistance |
| Concentration of a solution | Volume of solvent added |
Table 3: Common Mistakes in Graphing y = 1/x
| Mistake | Description |
|---|---|
| Forgetting the Center | Failing to plot the origin as the center of the graph. |
| Ignoring the Asymptotes | Graph intersects the asymptotes instead of approaching them. |
| Miscalculating Points | Incorrectly determining the coordinates of points on the graph. |
Table 4: Effective Strategies for Graphing y = 1/x
| Strategy | Description |
|---|---|
| Use a Table | Create a table of values to visualize the relationship. |
| Draw a Coordinate System | Accurately draw the axes and label them. |
| Use Technology | Utilize graphing software or online tools. |
Conclusion
The graph of y = 1/x is a fundamental concept in mathematics with practical applications in various fields. By understanding the inverse variation relationship and following effective graphing strategies, individuals can accurately represent and analyze this important function.
