Introduction
As an educator, it is crucial to establish clear grading policies and practices that promote student learning and academic achievement. One essential component of grading is the use of a grading percentages chart, which outlines the percentage range assigned to each letter grade. This article provides a comprehensive overview of grading percentages charts, including their importance, various types, and effective strategies for implementation.

Importance of Grading Percentages Charts
Grading percentages charts serve several important purposes within the educational setting:
-
Provide Clarity and Consistency: They clearly and concisely communicate the grading expectations to students, establishing a shared understanding of academic performance standards. This consistent approach helps reduce confusion and ensures fairness in the grading process.
-
Promote Objective Grading: By assigning specific ranges to letter grades, grading percentages charts help minimize subjectivity in the grading process. They provide a numerical basis for evaluating student performance, reducing the potential for bias or personal opinion to influence grades.
-
Facilitate Student Goal Setting: Grading percentages charts empower students by providing them with a clear understanding of their progress towards academic goals. They can track their grades and identify areas where they need to improve.
-
Inform Instructional Practice: Grading percentages charts can provide valuable insights into student performance and learning patterns. Educators can use this information to adjust their teaching strategies, addressing areas where students struggle and reinforcing concepts that they have mastered.
Types of Grading Percentages Charts
There are various types of grading percentages charts that educators can use, each with its own advantages and disadvantages:
-
100-Point Scale: This traditional grading system assigns a percentage value to each assignment or exam, with 100% representing the highest possible score. It is straightforward and easy to understand but may not provide sufficient differentiation for students at the lower or higher end of the grading spectrum.
-
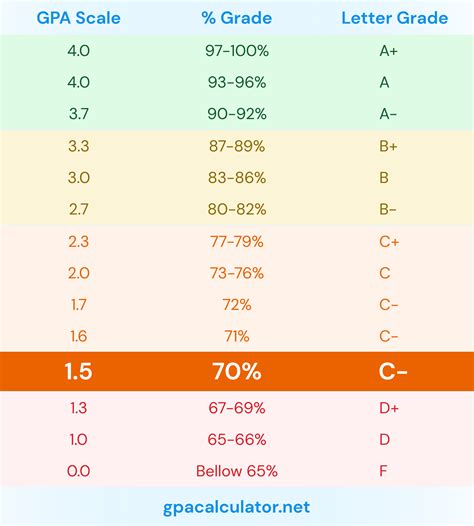
4.0 Grade Point Average (GPA) Scale: This scale assigns a point value to each letter grade, with 4.0 representing an A and 0.0 representing an F. It is commonly used in higher education and allows for more differentiation among student performance, particularly at the upper end of the grading scale.
-
Weighted Grading System: This system assigns different weights to different assignments or exams, reflecting their importance or difficulty. It allows educators to prioritize specific assessments and ensure that they have a greater impact on the final grade.
-
Standards-Based Grading: This system focuses on assessing student proficiency against specific learning standards or objectives. It may not use traditional letter grades but rather report student progress as meeting or not meeting standards.
Strategies for Effective Implementation of Grading Percentages Charts
To ensure that grading percentages charts are implemented effectively, educators should consider the following strategies:
-
Communicate Clearly and Regularly: Discuss the grading percentages chart with students at the beginning of the course or semester. Explain the purpose, expectations, and any specific criteria for assigning grades.
-
Provide Timely and Constructive Feedback: Regularly provide students with feedback on their performance, highlighting both strengths and areas for improvement. Constructive feedback helps students understand their progress and identify areas where they need to focus their efforts.
-
Consider Student Diversity: Recognize that students have different learning styles and needs. Adapt the grading percentages chart as necessary to accommodate diverse student populations.
-
Use a Variety of Assessment Methods: Employ a range of assessment methods, including tests, quizzes, assignments, and projects, to accurately evaluate student learning.
-
Maintain Fairness and Consistency: Grade students fairly and consistently, adhering to the established grading percentages chart. Avoid bias or personal opinion influencing grades.
Common Grading Percentages Charts
The following table provides examples of common grading percentages charts:
| Letter Grade | Percentage Range |
|---|---|
| A | 90-100% |
| B | 80-89% |
| C | 70-79% |
| D | 60-69% |
| F | 0-59% |
Grading Percentages Charts in Different Educational Settings
Grading percentages charts are used in various educational settings, including:
- Elementary Education: Typically uses a 100-point scale or standards-based grading.
- Secondary Education: Often uses a 100-point scale or weighted grading system.
- Higher Education: Commonly employs a 4.0 GPA scale or standards-based grading.
Key Considerations for Establishing Grading Percentages Charts
When establishing grading percentages charts, consider the following key factors:
- Institutional Policies: Adhere to any institutional policies or guidelines regarding grading practices.
- Course Objectives: Align the grading percentages chart with the learning objectives and desired student outcomes.
- Student Learning: Ensure that the grading percentages chart promotes student learning and academic achievement.
- Feedback and Transparency: Provide clear and regular feedback to students and maintain transparency in the grading process.
Effective Strategies for Grading
Educators can employ the following strategies to enhance the effectiveness of their grading practices:
- Use Rubrics for Assessments: Develop clear rubrics that outline the criteria and expectations for each assessment, reducing subjectivity in grading.
- Provide Opportunities for Revision: Allow students to revise and resubmit work to demonstrate their understanding and improve their grades.
- Consider Student Self-Assessment: Encourage students to reflect on their own learning and provide self-assessments to promote metacognition.
- Use Technology to Enhance Grading: Utilize online grading platforms or tools to streamline the grading process and provide timely feedback to students.
Frequently Asked Questions About Grading Percentages Charts
Q: What is the most common grading percentages chart used in schools?
A: The 100-point scale is the most commonly used grading percentages chart in elementary and secondary education.
Q: How can I ensure that my grading percentages chart is fair?
A: Communicate the grading percentages chart clearly to students, provide timely feedback, avoid bias, and adhere to institutional policies.
Q: Can I use different grading percentages charts for different courses?
A: Yes, you can customize the grading percentages chart to align with the learning objectives and assessment methods of each course.
Q: How can I use a grading percentages chart to promote student learning?
A: Grading percentages charts provide clarity and consistency, facilitate student goal setting, and inform instructional practice, all of which contribute to student learning.
Q: What are the benefits of using a weighted grading system?
A: A weighted grading system allows educators to prioritize specific assessments and ensure that they have a greater impact on the final grade.
Q: How can I use technology to enhance my grading practices?
A: Online grading platforms and tools can streamline the grading process, provide timely feedback, and facilitate communication with students.
Q: Why is it important to consider student diversity when establishing grading percentages charts?
A: Accommodating diverse student learning styles and needs ensures fairness in the grading process and promotes inclusive educational practices.