Introduction
In the realm of statistical analysis, the critical value Z table plays a crucial role in hypothesis testing and making inferences from data. It provides a reference point for determining whether observed results are significantly different from what would be expected by chance. This article delves into the intricacies of the critical value Z table, its applications, and how it empowers researchers to draw meaningful conclusions from their data.

What is a Critical Value Z Table?
A critical value Z table is a statistical table that contains a series of predetermined values corresponding to different levels of significance (α). For a given α level, the critical value Z represents the boundary that separates the region of acceptance from the region of rejection in a hypothesis test.
The critical value Z table is typically used in conjunction with a test statistic, which measures the discrepancy between the observed data and the hypothesized value. If the absolute value of the test statistic exceeds the critical value Z, the null hypothesis is rejected, and the alternative hypothesis is accepted.
Calculating Critical Values
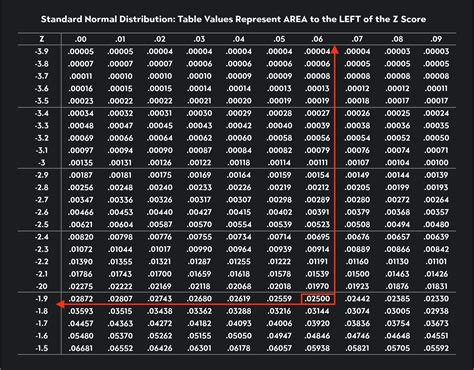
Critical values are calculated based on the standard normal distribution, also known as the Z-distribution. The Z-distribution assumes that the data is normally distributed with a mean of 0 and a standard deviation of 1.
The critical value Z can be calculated using the following formula:
Z = Z(α/2)
where Z(α/2) represents the critical value that corresponds to the significance level α/2.
Applications of the Critical Value Z Table
The critical value Z table finds widespread application in various statistical procedures, including:
- Hypothesis testing: Determines whether observed differences are statistically significant or due to chance.
- Confidence intervals: Constructs intervals that are likely to contain the true population parameter with a specified level of confidence.
- Sampling distributions: Assesses the distribution of sample statistics under different scenarios.
- Quality control: Monitors and improves processes by setting acceptance and rejection criteria.
Step-by-Step Guide to Using the Critical Value Z Table
- Determine the level of significance (α): Choose an appropriate α level based on the research question and desired confidence level.
- Find the corresponding critical value Z: Use the critical value Z table to identify the critical value Z associated with α/2.
- Calculate the test statistic: Calculate the test statistic for the specific statistical procedure being used.
- Compare the test statistic to the critical value: If the absolute value of the test statistic exceeds the critical value Z, the null hypothesis is rejected.
- Make a conclusion: Based on the comparison, determine whether the observed results are statistically significant and support the alternative hypothesis.
Examples of Critical Value Z Table Applications
Example 1: Hypothesis Testing
A researcher wants to test the hypothesis that the average weight of newborn babies is 8 pounds. A random sample of 50 newborns has an average weight of 7.8 pounds with a standard deviation of 1.2 pounds. Using a significance level of α = 0.05, the critical value Z is 1.96 from the critical value Z table.
Test statistic: (7.8 – 8) / (1.2 / √50) = -2.45
Conclusion: Since the absolute value of the test statistic (-2.45) exceeds the critical value Z (1.96), the null hypothesis is rejected. The researcher concludes that the average weight of newborn babies is statistically different from 8 pounds at a significance level of α = 0.05.
Example 2: Confidence Interval
A survey of 1000 registered voters finds that 60% of them support a particular political candidate. Using a confidence level of 95%, the critical value Z is 1.96 from the critical value Z table.
Margin of error: 1.96 * √(0.6 * 0.4 / 1000) = 0.029
Confidence interval: (0.6 – 0.029, 0.6 + 0.029) = (0.571, 0.629)
Conclusion: The researcher is 95% confident that the proportion of registered voters who support the candidate lies between 57.1% and 62.9%.
Strategies for Enhancing Critical Value Z Table Utilization
- Understand the underlying assumptions: Ensure that the data meets the assumptions of the normal distribution or other relevant statistical models.
- Choose appropriate significance levels: Carefully consider the implications and potential consequences of different significance levels.
- Replicate and validate findings: Repeat studies or use different samples to confirm the reliability and generalizability of conclusions.
- Consider effect sizes: Evaluate not only statistical significance but also the magnitude and practical relevance of observed effects.
- Seek professional consultation: Consult with statisticians or other experts for complex or novel statistical analyses.
Conclusion
The critical value Z table is a fundamental tool in statistical analysis, providing a benchmark against which observed data can be compared. By leveraging the critical value Z table, researchers gain the ability to make informed decisions, draw meaningful conclusions, and advance scientific knowledge. The versatility and applicability of the critical value Z table extend across various fields, empowering researchers to make evidence-based judgments and drive progress in countless domains.
Additional Information
Tables:
- Critical Value Z Table for Significance Levels
- Critical Value Z Table for Confidence Intervals
- Percentile Points of the Standard Normal Distribution
- p-Values and Critical Value Z Table Equivalents
Resources:
- Critical Value Z Table Calculator
- Step-by-Step Guide to Using the Critical Value Z Table
- Understanding the Critical Value Z Table