Introduction

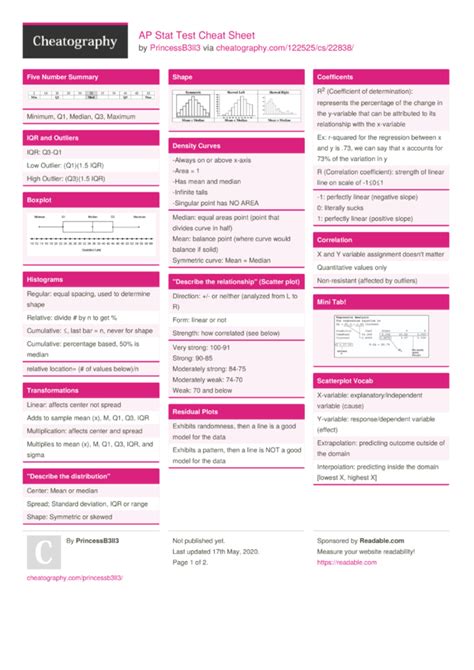
Are you feeling overwhelmed by the vastness of AP Statistics? Fear not, for this comprehensive cheat sheet will provide you with a concise overview of key concepts, formulas, and strategies to help you conquer the exam. From probability to hypothesis testing, we’ve got you covered.
Chapter 1: Probability
- Discrete vs. Continuous Probability Distributions: Discrete distributions have a finite number of possible outcomes, while continuous distributions have an infinite number.
- Expected Value: The average value of a random variable.
- Standard Deviation: A measure of how spread out a distribution is.
- Normal Distribution: A bell-shaped distribution that is often used to model real-world data.
Chapter 2: Hypothesis Testing
- Null Hypothesis (H0): The hypothesis that there is no significant difference.
- Alternative Hypothesis (Ha): The hypothesis that there is a significant difference.
- Significance Level (α): The probability of rejecting H0 when it is true.
- P-value: The probability of obtaining results as extreme or more extreme than the observed data.
- Rejecting or Failing to Reject H0: Based on the P-value, we either reject H0 (conclude there is a significant difference) or fail to reject H0 (conclude there is not enough evidence to say there is a difference).
Chapter 3: Confidence Intervals
- Confidence Level: The percentage of the time that the interval will contain the true population parameter.
- Confidence Interval: A range of values that is likely to contain the true population parameter.
- Standard Error: A measure of how much the sample mean is likely to vary from the population mean.
Chapter 4: Regression
- Linear Regression: A model that predicts a continuous variable using one or more predictor variables.
- Correlation Coefficient: A measure of the strength and direction of the relationship between two variables.
- Least Squares Regression Line: The line that best fits the data points and minimizes the sum of the squared errors.
Chapter 5: Sampling and Inference
- Central Limit Theorem: The distribution of sample means approaches a normal distribution as the sample size increases.
- Sampling Distribution: The distribution of sample statistics (e.g., means, proportions) from repeated samples.
- Standard Error of the Mean: The standard deviation of the sampling distribution.
Chapter 6: Non-Parametric Tests
- Chi-Square Test: A test for categorical data used to test for independence or goodness of fit.
- Spearman’s Rank Correlation: A measure of correlation for ordinal data.
- Mann-Whitney U Test: A non-parametric alternative to the t-test for two independent samples.
Chapter 7: Test Taking Strategies
- Manage Your Time: Budget your time wisely and allocate it to each section.
- Read the Question Carefully: Understand the prompt and what is being asked.
- Show Your Work: Partial credit can save you points.
- Use the Multiple Choice Options: Eliminate incorrect answers or narrow down options.
- Don’t Guess: Educated guesses are better than random guesses, but if you’re not sure, leave it blank.
Chapter 8: Glossary
- Confidence Interval: A range of values that is likely to contain the true population parameter.
- Correlation Coefficient: A measure of the strength and direction of the relationship between two variables.
- Hypothesis Test: A statistical procedure used to make a decision about the population parameter based on a sample.
- P-value: The probability of obtaining results as extreme or more extreme than the observed data.
- Probability Distribution: A mathematical function that describes the probability of different outcomes.
- Standard Deviation: A measure of how spread out a distribution is.
Conclusion
With this cheat sheet in hand, you are well-equipped to tackle AP Statistics with confidence. Remember to practice regularly, seek help when needed, and stay positive. Good luck on your exam!
