In the realm of spectroscopy, the absorbance vs wavelength graph stands as a fundamental tool for analyzing the interaction between light and matter. This graph provides valuable insights into the absorption, transmission, and reflection of electromagnetic radiation, shedding light on the properties of various substances.

What is Absorbance?
Absorbance, denoted by the symbol “A,” is a measure of the amount of light absorbed by a sample. It is defined as the logarithm (base 10) of the ratio of the intensity of the incident light (I0) to the intensity of the transmitted light (I):
A = log10(I0/I)
The Absorbance vs Wavelength Graph
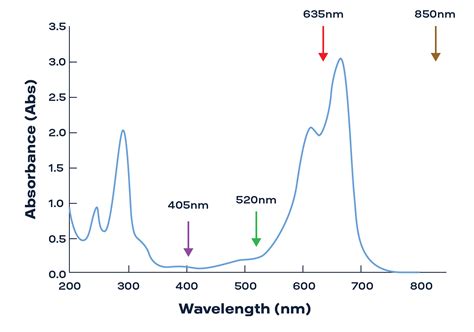
The absorbance vs wavelength graph plots the absorbance of a sample as a function of the wavelength of the incident light. This graph typically exhibits a series of peaks and valleys, each corresponding to the absorption or transmission of specific wavelengths of light.
Significance of the Graph
The absorbance vs wavelength graph serves several crucial purposes:
- Identification of substances: The unique pattern of peaks and valleys in the absorbance spectrum can be used to identify specific substances. This is a fundamental principle behind techniques such as atomic absorption spectroscopy and UV-Vis spectrophotometry.
- Determination of concentration: The absorbance of a sample is directly proportional to its concentration. By measuring the absorbance at a specific wavelength, it is possible to determine the concentration of the analyte in the sample.
- Structural analysis: The absorbance spectrum of a compound can provide information about its molecular structure and functional groups. Different chemical bonds and molecular arrangements exhibit characteristic absorbance patterns.
Applications of Absorbance vs Wavelength Graphs
The absorbance vs wavelength graph finds widespread application in various fields, including:
- Analytical chemistry: Identifying and quantifying compounds in samples (e.g., pharmaceutical analysis, environmental monitoring)
- Biochemistry: Studying the structure and function of biomolecules (e.g., DNA, proteins)
- Materials science: Characterizing the optical properties of materials (e.g., semiconductors, polymers)
- Environmental science: Monitoring pollutants and evaluating water quality
- Medicine: Diagnosing diseases and monitoring patient health
Absorption and Transmission Spectra
The absorbance spectrum is closely related to the transmission spectrum, which plots the percentage of incident light transmitted through the sample as a function of wavelength. The transmission spectrum is the inverse of the absorbance spectrum, and the two graphs provide complementary information.
Factors Affecting Absorbance
The absorbance of a sample can be influenced by several factors, including:
- Concentration of the analyte: Higher concentrations lead to higher absorbance.
- Path length: The distance the light travels through the sample affects absorbance.
- Temperature: Temperature can alter the absorption properties of a substance.
- pH: pH can affect the ionization state of the analyte, influencing its absorption spectrum.
- Interfering substances: The presence of other substances in the sample can interfere with the absorbance of the analyte.
Advantages and Disadvantages of Using Absorbance vs Wavelength Graphs
Advantages:
- Provides a comprehensive fingerprint of a substance’s optical properties
- Enables identification and quantification of substances
- Offers insights into molecular structure and functional groups
- Applicable to a wide range of compounds and materials
Disadvantages:
- Can be sensitive to experimental conditions (e.g., temperature, pH)
- May require specialized equipment and expertise to interpret
- Can be time-consuming to acquire and analyze the data
Conclusion
The absorbance vs wavelength graph is an invaluable tool for understanding the interaction between light and matter. Its applications span a vast array of fields, from analytical chemistry to materials science. By harnessing the power of spectroscopy, scientists and researchers can gain deep insights into the composition, structure, and properties of various substances.