Introduction
The chi-square test is a statistical tool widely used in various scientific fields, including biology, to analyze categorical data and determine whether there is a significant difference between observed and expected results. Understanding the chi-square test is crucial for AP Biology students and professionals in the life sciences.

Chi-Square Test Fundamentals
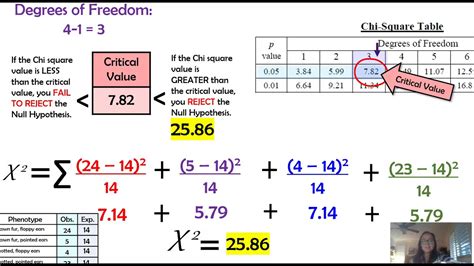
The chi-square test is based on the following formula:
χ² = Σ (O - E)² / E
where:
- χ² is the chi-square test statistic
- O is the observed frequency
- E is the expected frequency
The expected frequency is calculated based on the null hypothesis, which assumes there is no difference between the observed and expected results.
Interpreting Chi-Square Results
The chi-square test statistic is compared to a critical value, which is determined by the degrees of freedom and the significance level. If the chi-square test statistic exceeds the critical value, we reject the null hypothesis and conclude that there is a significant difference between the observed and expected results.
Practice Problems
Problem 1:
A scientist conducts an experiment to study the inheritance of flower color in pea plants. The following data is collected:
| Flower Color | Observed | Expected |
|---|---|---|
| Red | 120 | 130 |
| White | 80 | 70 |
Calculate the chi-square test statistic and interpret the results.
Problem 2:
A population of 500 birds is studied, and the following data is collected on their beak length:
| Beak Length (mm) | Observed | Expected |
|---|---|---|
| 10-15 | 120 | 100 |
| 15-20 | 200 | 180 |
| 20-25 | 100 | 120 |
Calculate the chi-square test statistic and interpret the results.
Tips and Tricks
- Choose the appropriate degrees of freedom: The degrees of freedom are determined by the number of independent observations minus the number of categories.
- Understand the significance level: The significance level is the probability of rejecting the null hypothesis when it is true. Common significance levels are 0.05 (5%) and 0.01 (1%).
- Avoid common mistakes: Avoid errors in calculating expected frequencies, degrees of freedom, and chi-square test statistics.
Applications of Chi-Square Analysis
Beyond genetics, the chi-square test has numerous applications in biology and other fields, including:
- Population genetics: Studying gene frequencies, allele frequencies, and Hardy-Weinberg equilibrium
Table 1: Applications of Chi-Square Analysis in Biology
| Application | Description |
|---|---|
| Population genetics | Studying gene frequencies, allele frequencies, and Hardy-Weinberg equilibrium |
| Evolution | Studying natural selection and genetic drift |
| Ecology | Analyzing community structure, species diversity, and predator-prey relationships |
| Epidemiology | Investigating disease prevalence, risk factors, and transmission |
- Ecology: Analyzing community structure, species diversity, and predator-prey relationships
Table 2: Chi-Square Test in Ecology
| Application | Description |
|---|---|
| Community structure | Studying the distribution and abundance of species within a habitat |
| Species diversity | Measuring the variety and richness of species within a community |
| Predator-prey relationships | Analyzing the interactions between predators and their prey |
- Epidemiology: Investigating disease prevalence, risk factors, and transmission
Table 3: Chi-Square Test in Epidemiology
| Application | Description |
|---|---|
| Disease prevalence | Studying the proportion of individuals in a population who have a specific disease |
| Risk factors | Identifying factors that increase the likelihood of developing a disease |
| Transmission | Investigating how a disease spreads from one individual to another |
Conclusion
The chi-square test is a valuable statistical tool for analyzing categorical data and identifying significant differences between observed and expected results. By understanding the principles and applications of chi-square analysis, AP Biology students and professionals in the life sciences can effectively interpret and analyze genetic data, study population dynamics, and investigate a wide range of biological phenomena.
