Introduction
Linear regression is a fundamental statistical technique used to model the relationship between a dependent variable and one or more independent variables. It is widely applied in various fields, including economics, healthcare, and education. The t-test is a statistical test used to determine if the slope of the regression line is significantly different from zero. In AP Statistics, the linear regression t-test plays a crucial role in assessing the significance of the relationship between variables. This article provides a comprehensive guide to linear regression t-test in AP Stats, including its concept, assumptions, steps, and applications.

Concept of Linear Regression T-Test
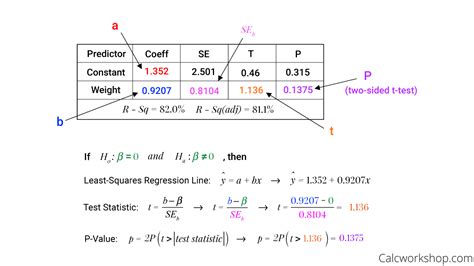
The linear regression t-test evaluates the statistical significance of the slope of the regression line. It assumes that the relationship between the dependent and independent variables is linear and that the errors are normally distributed. The t-test statistic is calculated as:
t = (b1 - b0) / sqrt(MSE / (SSx * n))
where:
- b1 is the estimated slope
- b0 is the hypothesized slope (usually 0)
- MSE is the mean square error
- SSx is the sum of squares of the independent variable
- n is the number of observations
Assumptions of Linear Regression T-Test
The linear regression t-test relies on several assumptions:
- Linearity: The relationship between the dependent and independent variables is linear.
- Normality: The errors are normally distributed.
- Independence: The observations are independent of each other.
- Homoscedasticity: The variance of the errors is constant.
- No outliers: The data contains no extreme values.
Steps of Linear Regression T-Test
The linear regression t-test involves the following steps:
-
State the null and alternative hypotheses:
* H0: The slope is zero (no significant relationship)
* Ha: The slope is not zero (significant relationship) - Calculate the t-statistic: Use the formula above.
- Determine the p-value: Find the p-value using a t-distribution with n-2 degrees of freedom.
-
Make a decision: Compare the p-value to the significance level (usually 0.05).
* If p-value < significance level, reject H0 (significant relationship)
* If p-value > significance level, fail to reject H0 (no significant relationship)
Applications of Linear Regression T-Test
The linear regression t-test is used in various applications, including:
- Hypothesis testing: To determine if there is a significant relationship between variables.
- Model selection: To select the best model among multiple regression models.
- Variable selection: To identify which independent variables are significant in the model.
- Prediction: To predict the dependent variable for new values of the independent variables.
Tips and Tricks
- Check the assumptions of the t-test before performing it.
- Use scatterplots and residual plots to diagnose any potential violations of the assumptions.
- Transform the data if necessary to meet the assumptions.
- Consider using a non-parametric test if the assumptions are not met.
Pros and Cons of Linear Regression T-Test
Pros:
- Simple to understand and implement.
- Provides a statistical measure of the significance of the relationship.
Cons:
- Assumes linearity and normality.
- May not be suitable for complex relationships.
- Can be sensitive to outliers.
Creative Applications
The linear regression t-test can be used in novel ways to generate ideas for new applications, such as:
- Customer segmentation: Using t-tests to identify customer segments with distinct preferences or behaviors.
- Fraud detection: Using t-tests to detect unusual patterns in financial transactions.
- Health risk prediction: Using t-tests to assess the risk of developing certain diseases based on various factors.
Conclusion
The linear regression t-test is a fundamental statistical tool in AP Statistics used to determine the significance of the relationship between variables. By understanding its concept, assumptions, steps, and applications, students can effectively utilize this test to analyze data and draw meaningful conclusions. It is important to note the limitations of the t-test and consider alternative methods when the assumptions are not met.