In the realm of statistics and probability, the bell curve, also known as the normal distribution, stands as a cornerstone concept. This ubiquitous distribution manifests itself in countless natural and social phenomena, offering insights into the patterns of variation within data. To delve deeper into its nuances, we introduce the concept of percentiles, a powerful tool for understanding the relative position of values within a bell curve.

Understanding Percentiles
Percentiles partition a distribution into 100 equal parts, allowing us to determine the percentage of data falling below, above, or within a specific value. For instance, the 25th percentile (Q1) represents the value at which 25% of the data falls below it, while the 75th percentile (Q3) indicates that 75% of the data lies below it.
The median (Q2), synonymous with the 50th percentile, bisects the distribution into two halves. It signifies the value above and below which 50% of the data resides. These percentiles provide a concise summary of the distribution’s shape and central tendency.
Applications of Bell Curve and Percentiles
The bell curve with percentiles finds myriad applications across various disciplines:
- Education: Standardized tests, such as the SAT and ACT, employ percentiles to compare students’ scores relative to their peers.
- Finance: Risk managers leverage percentiles to assess the potential loss associated with investments.
- Market research: Businesses utilize percentiles to segment their customer base based on income, age, or other characteristics.
- Medical research: Clinical trials often report results in terms of percentiles, indicating the efficacy and safety of new treatments.
- Quality control: Manufacturers use percentiles to monitor product quality and identify areas for improvement.
Benefits of Using Percentiles
- Comparative analysis: Percentiles enable easy comparison between different groups or populations.
- Data interpretation: Percentiles simplify complex data distributions, making them more accessible and interpretable.
- Decision-making: By understanding the distribution of data, percentiles empower informed decision-making.
- Trend analysis: Percentiles allow for the tracking of changes in data patterns over time.
- Risk assessment: Percentiles aid in quantifying the likelihood of extreme events.
Statistical Formulas for Percentiles
Calculating percentiles involves using statistical formulas:
- Percentile formula: Pth percentile (P) = L + (P/100) x (U – L)
- Linear interpolation formula: Pth percentile (P) = L + ((P – (K-1))/K) x (A – L)
Where:
– L: Lower boundary of the percentile interval
– U: Upper boundary of the percentile interval
– K: Number of observations in the interval
– A: Midpoint of the interval
Creative Applications of the Bell Curve with Percentiles
Beyond its traditional applications, the bell curve with percentiles inspires novel approaches:
- Behavioral science: Understanding the distribution of human behavior, such as reaction times and decision-making patterns.
- Machine learning: Using percentiles as a metric for model evaluation and anomaly detection.
- Process optimization: Identifying bottlenecks and inefficiencies in operational processes.
- Personalized medicine: Developing targeted treatments based on individual patient characteristics.
- Predictive analytics: Forecasting future trends and outcomes based on historical data patterns.
Effective Strategies for Working with Percentiles
- Determine appropriate percentiles: Choose percentiles that align with the specific analytical objectives.
- Consider the sample size: Ensure the sample size is sufficient to provide meaningful percentile estimates.
- Use appropriate statistical tools: Utilize statistical software or calculators for accurate percentile calculations.
- Interpret percentiles in context: Understand the distribution of the data and the significance of the calculated percentiles.
- Communicate percentiles effectively: Clearly present percentile results in tables, graphs, or summaries.
Tables for Understanding Bell Curve with Percentiles
| Percentile | Description |
|---|---|
| Q1 (25th percentile) | 25% of data falls below this value |
| Q2 (Median / 50th percentile) | 50% of data falls below this value |
| Q3 (75th percentile) | 75% of data falls below this value |
| Pxxx (Pth percentile) | P% of data falls below this value |
| Percentile | Standard Normal Distribution (z-score) |
|---|---|
| Q1 (25th percentile) | -0.6745 |
| Q2 (Median / 50th percentile) | 0 |
| Q3 (75th percentile) | 0.6745 |
| Pxxx (Pth percentile) | z-score corresponding to P% using a standard normal distribution table |
| Percentile | Empirical Rule (assuming normal distribution) |
|---|---|
| Q1 (25th percentile) | Approximately 24% of data falls below this value |
| Q2 (Median / 50th percentile) | Approximately 50% of data falls below this value |
| Q3 (75th percentile) | Approximately 76% of data falls below this value |
| Pxxx (Pth percentile) | Approximately P% of data falls below this value |
| Percentile | Uses in Decision-Making |
|---|---|
| Q1 (25th percentile) | Identify underperformers or areas for improvement |
| Q2 (Median / 50th percentile) | Establish benchmarks or targets |
| Q3 (75th percentile) | Identify top performers or areas of excellence |
| Pxxx (Pth percentile) | Set performance goals or risk thresholds |
FAQs
-
What is the difference between a percentile and a percentage?
– A percentile is a value that divides a distribution into 100 equal parts, while a percentage expresses a value as a fraction of the whole (out of 100). -
How do I find the percentile of a value?
– Use the percentile formula or statistical software to calculate the percentile corresponding to the value. -
What is a standard normal distribution?
– A normal distribution with a mean of 0 and a standard deviation of 1, used for standardizing data for comparison. -
How do percentiles help in risk management?
– Percentiles quantify the likelihood of extreme events, aiding in risk assessment and mitigation. -
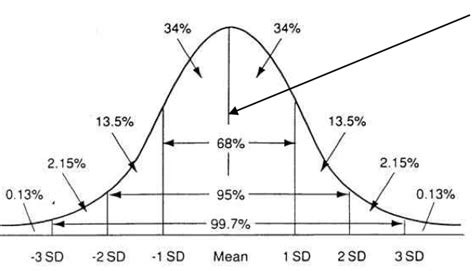
What is the empirical rule?
– In a normal distribution, approximately 95% of data falls within 2 standard deviations of the mean, corresponding to percentiles Q1 and Q3. -
How are percentiles used in data science?
– Percentiles serve as metrics for model evaluation, identifying outliers, and categorizing data for analysis. -
What is the role of percentiles in medical research?
– Percentiles provide insights into treatment efficacy, safety, and patient outcomes, guiding clinical decision-making. -
How can percentiles improve business decision-making?
– Percentiles help businesses understand customer behavior, identify market segments, and optimize marketing strategies.