Understanding the Language of Statistics
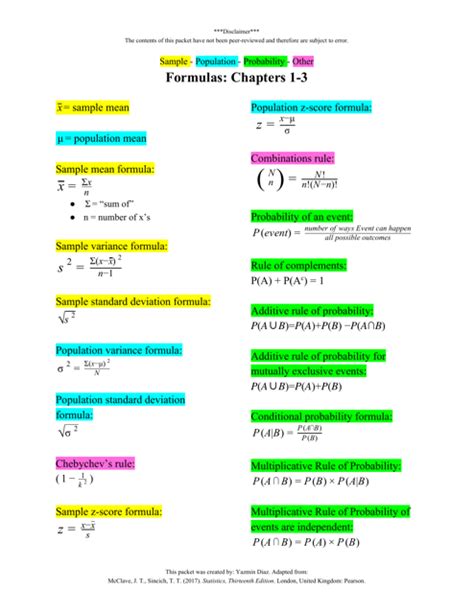
Statistics is a powerful tool for understanding data and making informed decisions. To effectively navigate the world of statistics, it’s essential to master the formulas and symbols that form its foundation. This comprehensive formula sheet provides a quick reference for core statistical concepts, equations, and notation.

Central Tendency and Variability
Mean (μ): Average value of a data set.
Formula: Mean = (Sum of all data values) / (Number of data values)
Median: Middle value of a data set when arranged in order.
Mode: Most frequently occurring value in a data set.
Range: Difference between the largest and smallest values in a data set.
Standard Deviation (σ): Measure of how spread out a data set is.
Formula: σ = √[Σ(xi – μ)² / (n – 1)]
Probability and Distributions
Probability: Likelihood of an event occurring.
Formula: Probability = Number of favorable outcomes / Total number of possible outcomes
Binomial Distribution: Probability of getting k successes in n independent trials.
Formula: P(k) = (n! / (k! * (n – k)!)) * p^k * (1 – p)^(n – k)
Normal Distribution: Bell-shaped distribution that models many natural phenomena.
Formula: f(x) = (1 / (σ * √(2π))) * e^(-(x – μ)² / (2σ²))
Hypothesis Testing and Correlation
Null Hypothesis (H0): Statement that no significant difference exists between two groups.
Alternative Hypothesis (Ha): Statement that a significant difference exists between two groups.
T-Test: Statistical test that compares the means of two independent groups.
Formula: t = (Mean1 – Mean2) / (√(Var1 / n1 + Var2 / n2))
Correlation Coefficient (r): Measure of the strength and direction of the relationship between two variables.
Formula: r = (Σ(xi – x̄)(yi – ȳ)) / √(Σ(xi – x̄)² Σ(yi – ȳ)²)
Confidence Intervals
Confidence Interval: Range of values within which a population parameter is likely to fall.
Formula: x̄ ± t* * (σ / √n)
Additional Symbols
n: Sample size
Σ: Summation
√: Square root
e: Base of the natural logarithm
π: Pi (3.14159)
χ²: Chi-squared distribution
F: F-distribution
Applications of Statistical Formulas
Statistical formulas have wide-ranging applications across various industries and disciplines:
- Healthcare: Analyzing clinical trials, predicting disease outcomes
- Finance: Forecasting stock prices, assessing risk
- Marketing: Understanding customer behavior, optimizing campaigns
- Education: Evaluating student performance, identifying areas for improvement
- Manufacturing: Quality control, optimizing production processes
Conclusion
Mastering the formulas and symbols of statistics empowers you to delve into data, uncover patterns, and make informed decisions. Whether you’re a researcher, analyst, or data-driven professional, this formula sheet provides a valuable resource for navigating the complex world of statistical analysis.
