Introduction
The mean of a frequency distribution is a crucial measure of central tendency that helps researchers and analysts understand the average value of a dataset. This statistic is widely used in probability and statistics to represent the typical value of a set of observations. This worksheet provides a thorough overview of the mean of a frequency distribution, its applications, and how to calculate it.

What is the Mean of a Frequency Distribution?
The mean, also known as the arithmetic mean, is a measure of central tendency that represents the average value of a set of observations. It is calculated by summing up all the values in a dataset and dividing the result by the total number of observations.
Formula:
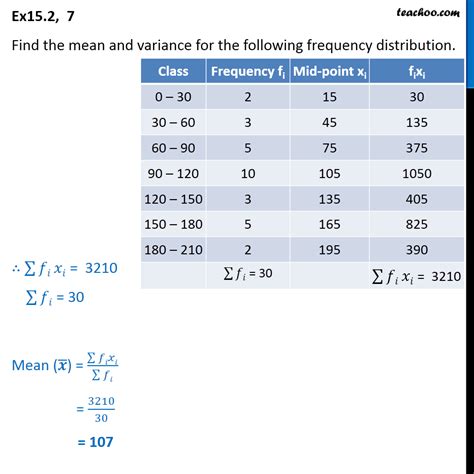
Mean = (Σx*f) / N
Where:
* Σx is the sum of all the values in the dataset
* f is the frequency of each value
* N is the total number of observations
Properties of the Mean
- The mean is always a number that falls within the range of the dataset.
- The mean is affected by outliers, which are extreme values that can skew the average.
- The mean is a stable measure, meaning that it is not easily affected by small changes in the data.
- The mean is a linear measure, which means that it can be used to calculate the mean of a weighted average.
Applications of the Mean
The mean of a frequency distribution has numerous applications in various fields, including:
- Data analysis: To determine the average value of a set of observations, such as the average height of students in a class or the average sales of a product over a period of time.
- Probability: To calculate the expected value of a random variable, which is the average outcome of a probability distribution.
- Sample surveys: To estimate the population mean based on a sample of data.
- Decision-making: To inform decisions by providing a numerical representation of the typical value of a dataset.
Calculating the Mean of a Frequency Distribution
Calculating the mean of a frequency distribution involves the following steps:
- Tabulate the data: Arrange the data into a frequency distribution table, displaying the values and their corresponding frequencies.
- Multiply each value by its frequency: Calculate the product of each value and its frequency.
- Sum the products: Add up all the products obtained in step 2.
- Divide by the total number of observations: Compute the mean by dividing the sum from step 3 by the total number of observations (N).
Example:
Consider the following frequency distribution:
| Value | Frequency |
|---|---|
| 2 | 3 |
| 4 | 5 |
| 6 | 2 |
| 8 | 1 |
Mean = [(23) + (45) + (62) + (81)] / 11 = 4.27
Tips and Tricks
- When calculating the mean, ensure that the data is accurate and representative of the population being studied.
- Consider using a calculator or statistical software to avoid errors in computation.
- If the dataset contains outliers, consider using the median or mode as alternative measures of central tendency.
- The mean can be used to compare different datasets or distributions.
Common Mistakes to Avoid
- Not distinguishing between mean and average: Mean and average are often used interchangeably, but they refer to different concepts in statistics. Mean is a specific measure of central tendency that is calculated using the aforementioned formula, while average can refer to any measure of central tendency, including the mean, median, or mode.
- Ignoring outliers: Outliers can significantly affect the mean, so it is important to be aware of their presence and consider their impact on the analysis.
- Using the mean in non-linear situations: The mean is a linear measure, so it may not be appropriate to use in situations where the relationship between the variables is non-linear.
Conclusion
The mean of a frequency distribution is a powerful statistic that provides valuable insights into the central tendency of a dataset. By understanding the concept of the mean and its applications, researchers and analysts can effectively analyze data, make informed decisions, and communicate their findings clearly. This worksheet has equipped you with the knowledge and tools to confidently calculate and interpret the mean of a frequency distribution.