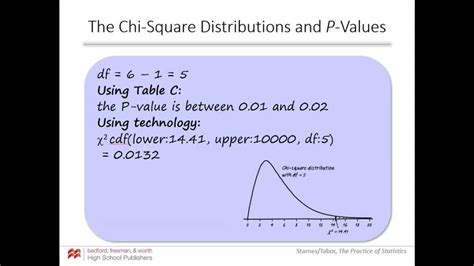
Welcome to AP Statistics Unit 2, the thrilling realm of probability and random variables! This unit will ignite your fascination with the art of predicting uncertain events. Prepare to embark on an intellectual adventure as we unravel the mysteries of chance and explore the fascinating world of probability.

Understanding Probability
Probability measures the likelihood of an event occurring. It’s like trying to guess the outcome of a coin toss – heads or tails? Probability comes to our rescue, assigning numerical values between 0 and 1 to quantify the chances of each outcome.
- 0 represents an impossible event (like rolling a seven on a standard six-sided die).
- 1 signifies a certain event (like drawing an ace from a standard deck of cards).
- Values between 0 and 1 indicate the varying degrees of possibility.
Types of Probability
Theoretical Probability
This type assumes an ideal scenario where all outcomes are equally likely. For instance, flipping a fair coin has a 50% probability of landing on heads or tails.
Experimental Probability
Based on repeated observations, this type estimates the probability of an event. Let’s say you flip a coin 100 times and record 60 heads. The experimental probability of getting heads is 60/100 = 0.6.
Random Variables: Quantifying Uncertainty
Random variables represent the possible outcomes of an experiment that can take on numerical values. They are like the numbers on a dice or the temperature readings on a thermometer.
- Discrete Random Variables: Take on specific, isolated values, like the number of students in a class or the number of phone calls received in an hour.
- Continuous Random Variables: Can take on any value within a given range, like the height of a person or the weight of a newborn baby.
Probability Distributions
Probability distributions depict the probability of each possible outcome of a random variable. They provide a graphical or numerical representation of the chances associated with different values.
- Discrete Probability Distribution: Lists the probability of each specific value (e.g., the probability of rolling a 2 on a die).
- Continuous Probability Distribution: Describes the probability of an outcome falling within a specific range (e.g., the probability of a person being between 5’0″ and 5’5″ tall).
Applications of Probability in the Real World
Probability finds applications in countless domains, including:
- Finance: Assessing investment risk, predicting stock prices
- Public Health: Modeling disease transmission, forecasting epidemics
- Manufacturing: Quality control, product reliability
- Gaming: Determining winning probabilities, designing fair games
- Weather Prediction: Forecasting rainfall, estimating storm intensity
- Social Sciences: Surveying public opinion, analyzing survey results
Key Takeaways
- Probability measures the likelihood of events occurring.
- Random variables quantify uncertainty by assigning numerical values to outcomes.
- Probability distributions depict the chances associated with different outcomes.
- Probability has far-reaching applications in diverse fields, from finance to public health.
Tips for Success in AP Stats Unit 2
- Practice, Practice, Practice: Solve numerous problems to enhance your understanding.
- Comprehend Concepts: Grasp the fundamental ideas behind probability and random variables.
- Master Techniques: Learn and apply the methods for calculating probabilities and analyzing distributions.
- Seek Support: Ask your teacher or peers for assistance when needed.
- Review Regularly: Revisit concepts and practice problems to reinforce your knowledge.
Tables
Table 1: Types of Probability
| Probability Type | Calculation |
|---|---|
| Theoretical | Based on equally likely outcomes |
| Experimental | Based on repeated observations |
Table 2: Types of Random Variables
| Random Variable Type | Example |
|---|---|
| Discrete | Number of passengers on a bus |
| Continuous | Height of a person |
Table 3: Types of Probability Distributions
| Distribution Type | Description |
|---|---|
| Discrete | Lists probabilities for each specific outcome |
| Continuous | Describes probabilities within a specified range |
Table 4: Applications of Probability
| Field | Application |
|---|---|
| Finance | Investment risk assessment |
| Public Health | Disease transmission modeling |
| Manufacturing | Product quality control |
| Gaming | Determining winning probabilities |
| Weather Prediction | Rainfall forecasting |
| Social Sciences | Survey data analysis |
