In the realm of statistical analysis, hypothesis testing plays a pivotal role in inferring the validity of claims or assumptions about a population. At the heart of this process lies the critical z value, a crucial threshold that aids researchers in determining whether observed data significantly deviates from the expected outcome.

Understanding the Critical Z Value
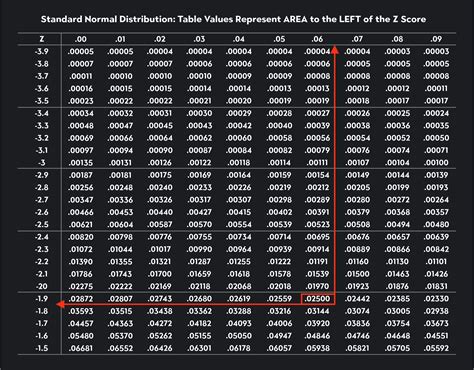
The critical z value is a numerical value derived from the standard normal distribution, which represents the probability of obtaining a certain z-score or more extreme. In hypothesis testing, the critical z value serves as a benchmark against which the calculated z-score of the sample is compared.
Calculation of the Critical Z Value
The critical z value is determined based on the desired significance level (α), which represents the maximum probability of incorrectly rejecting the null hypothesis when it is actually true. The most commonly used significance levels are 0.05, 0.01, and 0.005.
The formula for calculating the critical z value is:
Critical Z Value = zα/2
where α/2 is half of the significance level.
Interpretation of the Critical Z Value
The critical z value is interpreted in relation to the calculated z-score of the sample. If the calculated z-score falls within the critical z value range, it indicates that the observed data does not deviate significantly from the expected outcome under the null hypothesis. Conversely, if the calculated z-score falls outside the critical z value range, it suggests that the observed data is unlikely to have come from the null hypothesis, providing evidence in favor of the alternative hypothesis.
Applications of the Critical Z Value Chart
The critical z value chart is an indispensable tool in various statistical applications, including:
- Hypothesis Testing: Determining the statistical significance of observed differences between groups or populations.
- Confidence Interval Estimation: Establishing a range of values within which the true population mean is likely to fall.
- Sample Size Determination: Calculating the minimum sample size required to achieve a desired level of precision in hypothesis testing.
Real-World Examples
The critical z value chart finds practical applications across many fields, including:
- Medical Research: Assessing the effectiveness of new treatments by comparing the experimental group with a control group.
- Market Research: Determining whether a particular marketing campaign has led to a significant increase in sales.
- Educational Testing: Evaluating the performance of students against established norms or standards.
Benefits of Using the Critical Z Value Chart
Leveraging the critical z value chart offers numerous benefits:
- Objectivity: Provides a statistical foundation for decision-making, eliminating subjective interpretations.
- Accuracy: Enables researchers to draw valid conclusions about the population based on sample data.
- Consistency: Ensures uniformity in hypothesis testing, facilitating comparisons across different studies.
Pain Points and Motivations
Pain Points:
- Computational Complexity: Manual calculations of critical z values can be time-consuming and error-prone.
- Inaccessibility: Critical z value charts may not be readily available in certain situations, especially for non-statisticians.
Motivations:
- Convenience and Efficiency: Utilizing readily available critical z value charts saves time and reduces the risk of errors.
- Improved Understanding: Clear presentation of critical z values enhances comprehension and interpretation of statistical findings.
FAQs
-
What is the significance of the significance level?
The significance level determines the probability of rejecting the null hypothesis when it is true. A lower significance level indicates a stricter criterion, requiring stronger evidence to reject the null hypothesis. -
How do I determine the correct significance level?
The significance level is typically chosen based on the level of risk researchers are willing to tolerate in rejecting the null hypothesis when it is true. -
What happens if my calculated z-score is exactly equal to the critical z value?
In such cases, a two-tailed test is inconclusive, and researchers must consider additional factors or information to make a decision. -
Can I use a critical z value chart for non-normal distributions?
No, the critical z value chart is specifically applicable to normal distributions. For non-normal distributions, researchers must use appropriate transformations or non-parametric tests. -
How do I avoid the “p-hacking” problem?
“p-hacking” involves manipulating data or analysis to obtain a desired significance level. To avoid this, researchers should establish a clear hypothesis and analysis plan before collecting data. -
What alternatives are there to the critical z value chart?
Researchers can use online calculators or statistical software to calculate critical z values. Some software also provides p-values, which offer a direct assessment of the significance of observed differences. -
How can I use the critical z value chart in my research?
Researchers can utilize the critical z value chart to determine the critical z values for their specific significance level and compare them with their calculated z-scores. This enables them to make informed decisions about hypothesis testing and draw valid conclusions about their findings.
Conclusion
The critical z value chart serves as a cornerstone of statistical analysis, enabling researchers to evaluate the significance of observed differences. By understanding the concept, calculation, and interpretation of critical z values, researchers can ensure the objectivity, accuracy, and consistency of their hypothesis testing procedures. Leveraging the critical z value chart empowers researchers to draw meaningful conclusions and make informed decisions based on data-driven insights.