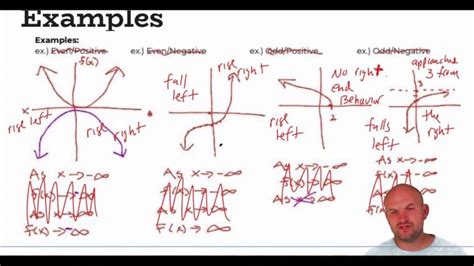
Precalculus, the gateway to calculus, plays a crucial role in shaping mathematical thinking and providing a solid foundation for advanced mathematics. Functions and their graphs form the backbone of precalculus, providing a powerful tool for modeling real-world phenomena. This comprehensive guide will demystify the world of precalculus functions and graphs, equipping you with the knowledge and skills to excel in your studies.

Functions in Precalculus
A function is a relation that assigns to each element of a set a unique element of another set. In precalculus, functions are often represented using equations, tables, or graphs. Some common types of functions include:
- Linear functions: y = mx + b
- Quadratic functions: y = ax^2 + bx + c
- Polynomial functions: y = a_nx^n + a_{n-1}x^{n-1} + … + a_1x + a_0
- Rational functions: y = (ax + b) / (cx + d)
Graphing Functions
Graphing functions is a fundamental skill in precalculus. It allows us to visualize the relationship between the input and output values of a function. To graph a function, follow these steps:
- Plot the intercepts: Find the x-intercepts (where y = 0) and y-intercept (where x = 0).
- Find the vertex: For quadratic functions, the vertex is the point where the function changes direction. It has coordinates (h, k), where h is the x-coordinate of the midpoint of the x-intercepts and k is the corresponding y-value.
- Use symmetry: Determine if the function is even (symmetric about the y-axis) or odd (symmetric about the origin).
- Plot additional points: Choose additional input values and use the function equation to find the corresponding output values.
- Connect the dots: Draw a smooth curve through the plotted points.
Common Mistakes to Avoid
When working with precalculus functions and graphs, it is common to make certain mistakes. Avoid these pitfalls to ensure accuracy:
- Not finding all intercepts: Make sure to find both the x-intercepts and y-intercepts.
- Confusing the vertex and intercepts: The vertex represents the maximum or minimum of a quadratic function, while the intercepts represent where the graph crosses the x- or y-axis.
- Incorrect symmetry determination: Even functions are symmetric about the y-axis, while odd functions are symmetric about the origin.
- Overgeneralizing: Not all functions have a vertex or symmetry. Quadratic functions have a vertex, while odd functions have neither vertex nor symmetry.
Step-by-Step Approach to Graphing Functions
- Identify the type of function: This will help you determine the basic shape of the graph.
- Find the intercepts: Plot the x- and y-intercepts to establish the position of the graph.
- Determine symmetry: Check for even or odd symmetry to identify any additional points of reference.
- Find additional points: Choose input values and use the function equation to find the corresponding output values.
- Plot the points: Mark the plotted points on the graph.
- Connect the dots: Draw a smooth curve through the points.
Applications of Functions and Graphs
Functions and graphs are not just theoretical concepts; they find practical applications in various fields:
- Natural sciences: Modeling growth and decay, projectile motion, and fluid flow.
- Social sciences: Analyzing population trends, economic growth, and survey results.
- Engineering: Designing structures, predicting fluid dynamics, and optimizing processes.
- Medicine: Monitoring patient health, diagnosing diseases, and developing treatment plans.
Useful Tables for Precalculus Functions and Graphs
| Function Type | Equation | Graph | Applications |
|---|---|---|---|
| Linear | y = mx + b | Straight line | Sloped lines and trends |
| Quadratic | y = ax^2 + bx + c | Parabola | Projectile motion and optimization |
| Polynomial | y = a_nx^n + a_{n-1}x^{n-1} + … + a_1x + a_0 | Various shapes | Modeling complex data sets |
| Rational | y = (ax + b) / (cx + d) | Hyperbola | Asymptotic behavior in economics and physics |
FAQs on Precalculus Functions and Graphs
- What is the difference between a function and an equation? An equation is a statement of equality between two expressions, while a function assigns a unique value to each input within a domain.
- Can a function have multiple intercepts? Yes, a function can have multiple x-intercepts or y-intercepts.
- Are all quadratic functions symmetric? No, only even quadratic functions are symmetric about the y-axis.
- What is the importance of asymptotes? Asymptotes are vertical or horizontal lines that the graph approaches but never intersects, indicating infinite behavior.
- How can I improve my graph sketching skills? Practice regularly, pay attention to the key features of different function types, and use graphing calculators for verification.
- What are some real-world applications of precalculus functions and graphs? Modeling population growth, optimizing design, and predicting financial trends are just a few examples.
Conclusion
Mastering precalculus functions and graphs is not just about memorizing formulas and techniques. It is about developing a deep understanding of the interplay between mathematical concepts and real-world applications. By embracing a proactive and inquisitive approach, you can unlock the power of functions and graphs and excel in your precalculus studies and beyond.
