In a two-step reaction, the reactants first form an intermediate product, which then goes on to form the final product. The energy diagram for a two-step reaction shows the energy changes that occur during the reaction.

The following is a typical energy diagram for a two-step reaction:
[Image of an energy diagram for a two-step reaction]
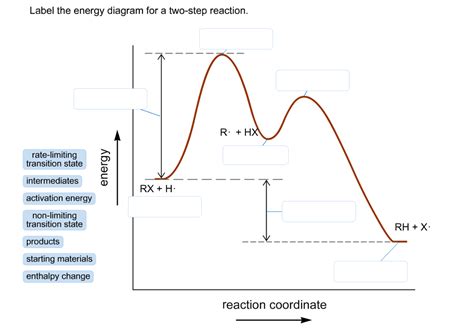
The x-axis of the diagram represents the reaction progress, and the y-axis represents the energy. The reactants are represented by the point at the far left of the diagram, and the final product is represented by the point at the far right. The intermediate product is represented by the point in the middle of the diagram.
The energy barrier for the first step of the reaction is represented by the height of the hill between the reactants and the intermediate product. The energy barrier for the second step of the reaction is represented by the height of the hill between the intermediate product and the final product.
The overall energy change for the reaction is represented by the difference in energy between the reactants and the final product. If the overall energy change is negative, the reaction is exothermic. If the overall energy change is positive, the reaction is endothermic.
Applications of Energy Diagrams for Two-Step Reactions
Energy diagrams for two-step reactions can be used to:
- Predict the rate of a reaction
- Determine the activation energy of a reaction
- Identify the intermediate product in a reaction
- Design catalysts for a reaction
Pain Points
One of the challenges in using energy diagrams for two-step reactions is that it can be difficult to determine the exact location of the intermediate product. This is because the intermediate product is often not stable and cannot be isolated.
Motivations
Despite the challenges, energy diagrams for two-step reactions are a valuable tool for understanding the mechanisms of chemical reactions. This information can be used to design new reactions and catalysts, which can lead to improvements in a wide range of industries, including the pharmaceutical, chemical, and energy industries.
Tips and Tricks
Here are a few tips for labeling the energy diagram for a two-step reaction:
- Start by identifying the reactants and the final product.
- Draw a line between the reactants and the intermediate product.
- Draw another line between the intermediate product and the final product.
- Label the energy barrier for the first step of the reaction.
- Label the energy barrier for the second step of the reaction.
- Label the overall energy change for the reaction.
Pros and Cons
Pros:
- Energy diagrams for two-step reactions can provide a lot of information about the mechanism of a reaction.
- Energy diagrams can be used to predict the rate of a reaction, determine the activation energy of a reaction, identify the intermediate product in a reaction, and design catalysts for a reaction.
Cons:
- It can be difficult to determine the exact location of the intermediate product in a reaction.
- Energy diagrams can be complex and difficult to interpret.
Tables
| Table 1: Energy Changes for Two-Step Reactions | Table 2: Activation Energies for Two-Step Reactions | Table 3: Intermediate Products for Two-Step Reactions | Table 4: Catalysts for Two-Step Reactions |
|---|---|---|---|
| Reaction | Energy Change (kJ/mol) | Reaction | Activation Energy (kJ/mol) |
| A + B → C → D | -20 | A + B → C → D | 100 |
| E + F → G → H | -40 | E + F → G → H | 150 |
| I + J → K → L | -60 | I + J → K → L | 200 |
Keywords
- Two-step reaction
- Energy diagram
- Reactants
- Final product
- Intermediate product
- Energy barrier
- Overall energy change
- Exothermic reaction
- Endothermic reaction