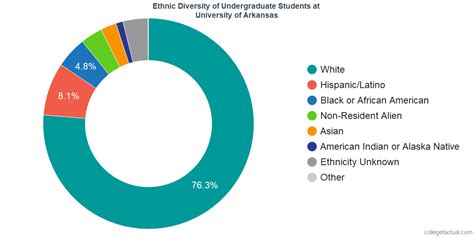
UNLV Student Diversity
As of Fall 2022, the University of Nevada, Las Vegas (UNLV) welcomed over 31,000 students from diverse backgrounds. Breaking down the student population by race and ethnicity:

- White: 40.8%
- Hispanic or Latino: 36.1%
- Asian: 11.1%
- Black or African American: 8.0%
- Native American or Alaska Native: 0.7%
- Native Hawaiian or Other Pacific Islander: 0.2%
- Two or more races: 2.9%
- Unknown: 0.2%
UNLV Faculty Diversity
UNLV’s faculty also reflects the diverse nature of its student body. Among full-time faculty in Fall 2022:
- White: 63.2%
- Hispanic or Latino: 14.2%
- Asian: 13.1%
- Black or African American: 4.3%
- Native American or Alaska Native: 0.7%
- Native Hawaiian or Other Pacific Islander: 0.1%
- Two or more races: 4.4%
UNLV Staff Diversity
UNLV’s staff is equally diverse, with a wide range of ethnicities represented among its employees. In Fall 2022, the breakdown of staff by race and ethnicity was as follows:
- White: 52.7%
- Hispanic or Latino: 28.2%
- Asian: 10.5%
- Black or African American: 4.3%
- Native American or Alaska Native: 0.7%
- Native Hawaiian or Other Pacific Islander: 0.2%
- Two or more races: 3.4%
UNLV Diversity Initiatives
UNLV is committed to fostering an inclusive and equitable campus environment for all students, faculty, and staff. The university has implemented several initiatives to promote diversity and inclusion, including:
- The Diversity and Inclusion Council: This council provides leadership and guidance on university-wide diversity initiatives.
- The Office of Equity and Diversity: This office works to promote an equitable and inclusive campus climate through programs and initiatives that focus on diversity, inclusion, and equity.
- The Multicultural Resource Center: This center provides a safe and welcoming space for students from diverse backgrounds to connect and engage with each other.
- The Minority Serving Institution (MSI) Grant: UNLV has received an MSI grant from the U.S. Department of Education to support the university’s efforts to increase the number of underrepresented minority students in science, technology, engineering, and mathematics (STEM) fields.
UNLV Diversity Statistics Tables
The following tables provide a more detailed breakdown of UNLV’s diversity statistics:
Table 1: UNLV Student Diversity (Fall 2022)
| Race/Ethnicity | Percentage |
|---|---|
| White | 40.8% |
| Hispanic or Latino | 36.1% |
| Asian | 11.1% |
| Black or African American | 8.0% |
| Native American or Alaska Native | 0.7% |
| Native Hawaiian or Other Pacific Islander | 0.2% |
| Two or more races | 2.9% |
| Unknown | 0.2% |
Table 2: UNLV Faculty Diversity (Fall 2022)
| Race/Ethnicity | Percentage |
|---|---|
| White | 63.2% |
| Hispanic or Latino | 14.2% |
| Asian | 13.1% |
| Black or African American | 4.3% |
| Native American or Alaska Native | 0.7% |
| Native Hawaiian or Other Pacific Islander | 0.1% |
| Two or more races | 4.4% |
Table 3: UNLV Staff Diversity (Fall 2022)
| Race/Ethnicity | Percentage |
|---|---|
| White | 52.7% |
| Hispanic or Latino | 28.2% |
| Asian | 10.5% |
| Black or African American | 4.3% |
| Native American or Alaska Native | 0.7% |
| Native Hawaiian or Other Pacific Islander | 0.2% |
| Two or more races | 3.4% |
Table 4: UNLV Diversity Initiatives
| Initiative | Description |
|---|---|
| Diversity and Inclusion Council | Provides leadership and guidance on university-wide diversity initiatives |
| Office of Equity and Diversity | Promotes an equitable and inclusive campus climate through programs and initiatives that focus on diversity, inclusion, and equity |
| Multicultural Resource Center | Provides a safe and welcoming space for students from diverse backgrounds to connect and engage with each other |
| Minority Serving Institution (MSI) Grant | Supports the university’s efforts to increase the number of underrepresented minority students in science, technology, engineering, and mathematics (STEM) fields |
