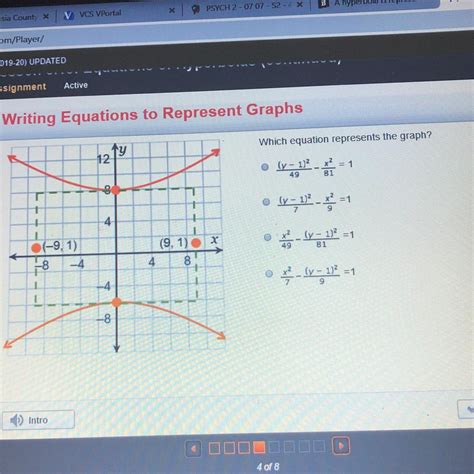
Graphs are a powerful tool for visualizing data and identifying trends. They can be used to represent a variety of relationships, from linear to exponential. But what if you want to find the equation that represents a graph?

That’s where regression analysis comes in. Regression analysis is a statistical technique that allows you to find the equation that best fits a set of data points. The equation can then be used to predict future values of the dependent variable based on the values of the independent variable.
Linear Regression
The simplest type of regression analysis is linear regression. Linear regression assumes that the relationship between the dependent and independent variables is linear, meaning that it can be represented by a straight line. The equation for a straight line is:
y = mx + b
where:
- y is the dependent variable
- x is the independent variable
- m is the slope of the line
- b is the y-intercept
Nonlinear Regression
If the relationship between the dependent and independent variables is not linear, then you will need to use nonlinear regression. Nonlinear regression can be used to fit a variety of different curves to data, such as exponential curves, logarithmic curves, and power curves.
The equation for a nonlinear curve will vary depending on the type of curve. However, the general form of the equation is:
y = f(x)
where:
- y is the dependent variable
- x is the independent variable
- f(x) is the nonlinear function
How to Find the Equation of a Graph
To find the equation of a graph, you will need to use a statistical software package. There are a number of different software packages available, such as SPSS, SAS, and R.
Once you have chosen a software package, you will need to import the data into the software. The software will then allow you to perform a regression analysis on the data.
The regression analysis will produce an equation that best fits the data. The equation can then be used to predict future values of the dependent variable based on the values of the independent variable.
Applications of Regression Analysis
Regression analysis is a powerful tool that can be used for a variety of applications, such as:
- Predicting future trends: Regression analysis can be used to predict future trends in a variety of areas, such as sales, marketing, and finance.
- Identifying relationships between variables: Regression analysis can be used to identify relationships between different variables. This information can be used to develop new products and services, or to improve existing ones.
- Making decisions: Regression analysis can be used to help you make decisions about a variety of issues, such as whether to invest in a new product or service, or whether to hire a new employee.
Conclusion
Regression analysis is a powerful tool that can be used for a variety of applications. By understanding how to find the equation of a graph, you can use regression analysis to predict future trends, identify relationships between variables, and make better decisions.
1. What is the difference between linear and nonlinear regression?
Linear regression assumes that the relationship between the dependent and independent variables is linear, while nonlinear regression assumes that the relationship is nonlinear.
2. What are some of the applications of regression analysis?
Regression analysis can be used to predict future trends, identify relationships between variables, and make better decisions.
3. How do I find the equation of a graph?
You can find the equation of a graph by using a statistical software package, such as SPSS, SAS, or R.
4. What is the purpose of the y-intercept in a linear equation?
The y-intercept is the value of the dependent variable when the independent variable is equal to zero.
5. What is the slope of a line?
The slope of a line is the rate of change of the dependent variable with respect to the independent variable.
6. How can I use regression analysis to predict future trends?
You can use regression analysis to predict future trends by plugging different values of the independent variable into the equation of the graph.
7. How can I use regression analysis to identify relationships between variables?
You can use regression analysis to identify relationships between variables by looking at the coefficients of the independent variables in the equation of the graph.
8. How can I use regression analysis to make better decisions?
You can use regression analysis to make better decisions by using the equation of the graph to predict future outcomes and by identifying relationships between different variables.
