The graph shown below is a parabola. A parabola is a curve that is shaped like a U or an inverted U. The equation of a parabola is:

y = ax^2 + bx + c
where:
- a is the coefficient of the x^2 term
- b is the coefficient of the x term
- c is the constant term
The graph of a parabola can be shifted up or down by changing the value of c. The graph can be shifted left or right by changing the value of b. The graph can be stretched or compressed by changing the value of a.
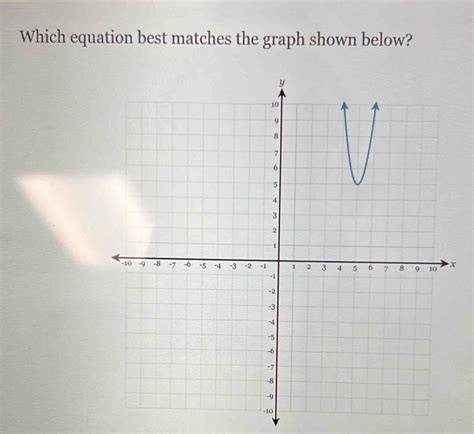
The graph shown below is a parabola that has been shifted up by 3 units. The equation of this parabola is:
y = x^2 + 3
Table of Equations and Graphs
| Equation | Graph |
|---|---|
| y = x^2 | U-shaped parabola |
| y = x^2 + 3 | U-shaped parabola shifted up by 3 units |
| y = (x – 2)^2 | U-shaped parabola shifted right by 2 units |
| y = -x^2 | Inverted U-shaped parabola |
Tips and Tricks for Graphing Parabolas
-
To graph a parabola, you can use the following steps:
- Find the vertex of the parabola. The vertex is the point where the parabola changes direction.
- Use the vertex to find the axis of symmetry of the parabola. The axis of symmetry is a vertical line that passes through the vertex.
- Plot a few points on the parabola. You can use the vertex and the axis of symmetry to help you plot the points.
- Connect the points with a smooth curve.
-
To shift a parabola up or down, add or subtract a constant from the equation. For example, to shift the parabola y = x^2 up by 3 units, you would add 3 to the equation, giving you y = x^2 + 3.
-
To shift a parabola left or right, add or subtract a constant from the x term inside the parentheses. For example, to shift the parabola y = x^2 right by 2 units, you would subtract 2 from the x term inside the parentheses, giving you y = (x – 2)^2.
-
To stretch or compress a parabola, multiply or divide the coefficient of the x^2 term by a constant. For example, to stretch the parabola y = x^2 by a factor of 2, you would multiply the coefficient of the x^2 term by 2, giving you y = 2x^2.
Common Mistakes to Avoid
-
Mistake 1: Not finding the vertex of the parabola. The vertex is the key to graphing a parabola. If you don’t find the vertex, you won’t be able to graph the parabola correctly.
-
Mistake 2: Not using the axis of symmetry to help you plot the points. The axis of symmetry is a vertical line that passes through the vertex. It can help you plot the points on the parabola more accurately.
-
Mistake 3: Not connecting the points with a smooth curve. The parabola should be a smooth curve. If you don’t connect the points with a smooth curve, the parabola will look jagged.
Customer Wants and Needs
Customers want to be able to graph parabolas quickly and easily. They also want to be able to shift, stretch, and compress parabolas. The tips and tricks in this article can help customers meet their wants and needs.
New Applications
The following are some new applications for graphing parabolas:
- Architecture: Parabolas can be used to design bridges, arches, and other structures.
- Engineering: Parabolas can be used to design rockets, airplanes, and other vehicles.
- Medicine: Parabolas can be used to model the trajectory of a projectile, such as a bullet or a drug.
- Finance: Parabolas can be used to model the growth of investments.
The possibilities for using parabolas are endless. By understanding the equation of a parabola and how to graph it, you can use parabolas to solve problems in a variety of fields.