Maps are an essential tool for geographers, helping them to visualize and understand the spatial distribution of people and places. In AP Human Geography, students will learn about a variety of different types of maps, each with its own unique purpose and set of characteristics.

Thematic Maps
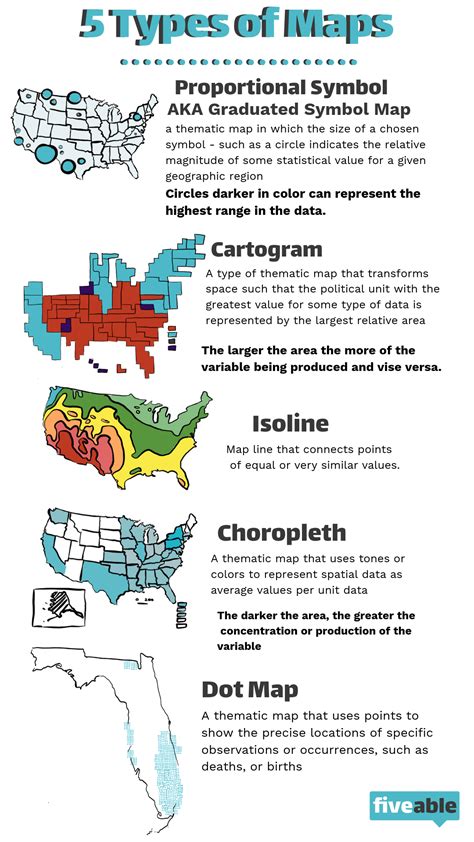
Thematic maps are designed to show the distribution of a particular theme, such as population density, land use, or economic activity. They use a variety of symbols and colors to represent different values of the theme, allowing geographers to quickly and easily see how the theme varies across a region.
Choropleth maps are the most common type of thematic map. They use different shades of color to represent different values of a theme. For example, a choropleth map of population density might use darker shades of color to represent areas with higher population densities.
Dot maps use dots to represent the distribution of a theme. Each dot represents a specific number of people or things. For example, a dot map of corn production might use one dot to represent 100,000 bushels of corn.
Isopleth maps use lines to connect points of equal value. For example, an isopleth map of temperature might use lines to connect points that have the same temperature.
Reference Maps
Reference maps are designed to provide a general overview of a region. They typically show political boundaries, major cities, and physical features such as rivers, mountains, and deserts. Reference maps can be used for a variety of purposes, such as planning a trip or locating a specific place.
Topographic maps are a type of reference map that shows the elevation of the land. They use contour lines to represent different elevations. Topographic maps can be used for a variety of purposes, such as planning a hiking trip or designing a construction project.
Road maps are a type of reference map that shows the location of roads and highways. They can be used for planning a road trip or finding directions to a specific location.
Other Types of Maps
In addition to thematic and reference maps, there are a variety of other types of maps that can be used for a variety of purposes.
Climate maps show the average temperature and precipitation for a particular region. They can be used to understand the climate of a region and how it might affect human activity.
Vegetation maps show the distribution of different types of vegetation. They can be used to understand the ecology of a region and how it might be affected by human activity.
Soil maps show the distribution of different types of soil. They can be used to understand the agricultural potential of a region and how it might be affected by human activity.
Using Maps in AP Human Geography
Maps are an essential tool for AP Human Geography students. They can be used to visualize and understand the spatial distribution of people and places, and to analyze how different factors interact to shape the human landscape.
Here are some tips for using maps in AP Human Geography:
- Identify the type of map. The first step is to identify the type of map that you are using. This will help you to understand the purpose of the map and how to interpret the information it contains.
- Read the map legend. The map legend will tell you what the different symbols and colors on the map represent. This information is essential for understanding the map.
- Look for patterns. Once you have identified the type of map and read the map legend, you can start to look for patterns in the data. These patterns can help you to identify trends and relationships between different variables.
- Draw conclusions. Finally, you can draw conclusions about the data on the map. These conclusions can be used to support your arguments in essays and on exams.
Maps are a powerful tool that can help you to understand the world around you. By learning how to use maps effectively, you can gain a deeper understanding of human geography and how it affects our lives.