Correlation, a statistical measure that gauges the strength and direction of the relationship between two variables, is often misunderstood or misinterpreted. To clarify the concept, let’s examine the following statements and determine their veracity:

Statement 1: Correlation implies causation.
This statement is false. Correlation measures the degree of association between variables, but it does not establish causality. Simply because two variables exhibit a correlation does not mean that one causes the other. Correlation can be the result of a third, unobserved variable influencing both variables. For example, a positive correlation between ice cream sales and crime rates may not indicate that ice cream causes crime, but rather that both are influenced by a common factor such as hot weather.
Statement 2: A correlation coefficient of 0 indicates no relationship between variables.
This statement is true. A correlation coefficient ranges from -1 to 1, where 0 indicates no correlation. A positive correlation coefficient (between 0 and 1) indicates that as one variable increases, the other tends to increase as well. A negative correlation coefficient (between -1 and 0) indicates that as one variable increases, the other tends to decrease.
Statement 3: A correlation coefficient close to 1 indicates a strong relationship between variables.
This statement is true. A correlation coefficient close to 1 (either positive or negative) indicates a strong linear relationship between variables. The closer the coefficient is to 1, the stronger the relationship. However, it’s important to note that correlation measures only the linear relationship, and it does not imply causation.
Statement 4: Correlation is always used to predict the future.
This statement is false. Correlation is a measure of historical or observed relationships between variables. It does not inherently predict future outcomes. While a strong correlation may suggest a possible relationship, it does not guarantee that the relationship will continue in the future. Other factors and variables may influence future outcomes, making predictions based solely on correlation potentially unreliable.
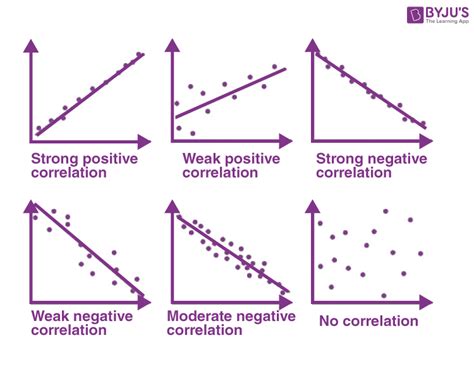
1. Scatter Plots: Visualizing the relationship between two variables using a scatter plot can provide valuable insights. Each data point on the plot represents a pair of values for the variables. If the points form a linear pattern, it suggests a correlation between the variables.
2. Correlation Coefficient: The correlation coefficient is a numerical measure of the strength and direction of the linear relationship between two variables. It ranges from -1 to 1, with 0 indicating no correlation, positive values indicating a positive relationship, and negative values indicating a negative relationship.
3. Significance Testing: Statistical significance testing determines whether the observed correlation is likely to have occurred by chance. The p-value, a probability value, is used to assess the statistical significance of the correlation. A low p-value (typically less than 0.05) indicates that the correlation is unlikely to be due to chance.
4. Causation vs. Correlation: Establishing causation requires careful experimentation and analysis beyond correlation. Correlation does not imply causation, and it is essential to consider other factors and variables that may influence the relationship between the two variables.
5. Practical Applications: Correlation analysis has wide-ranging applications in various fields, including:
- Identifying trends and patterns in data
- Assessing the effectiveness of interventions or programs
- Conducting market research and customer segmentation
- Developing predictive models and forecasting future outcomes
In medical research, correlation analysis plays a vital role in identifying relationships between variables and potential risk factors. However, establishing causation requires further investigation and controlled studies. For example, a study that finds a correlation between smoking and cancer does not prove that smoking causes cancer. It may be that another factor, such as exposure to secondhand smoke or a genetic predisposition, is the underlying cause of both smoking and cancer.
Table 1: Example of Correlation Analysis in Medical Research
| Variable 1 | Variable 2 | Correlation Coefficient | p-value |
|---|---|---|---|
| Body Mass Index (BMI) | Risk of Cardiovascular Disease | 0.56 | < 0.001 |
| Blood Pressure | Risk of Stroke | 0.42 | < 0.005 |
| Dietary Fiber Intake | Risk of Colon Cancer | -0.38 | < 0.01 |
Independence, in statistics, refers to the lack of a relationship between two variables. If two variables are independent, then the value of one variable does not affect the value of the other. A correlation coefficient of 0 indicates independence between variables.
Table 2: Key Differences Between Correlation and Independence
| Characteristic | Correlation | Independence |
|---|---|---|
| Relationship Between Variables | Exists | Does not exist |
| Correlation Coefficient | Non-zero (between -1 and 1) | 0 |
| Effect of One Variable on Another | Affects the other variable | Does not affect the other variable |
Businesses leverage correlation analysis to understand customer behavior, optimize marketing campaigns, and improve product development. For instance, a retailer may find a positive correlation between customer satisfaction and repeat purchases. Using this insight, they can enhance customer service and loyalty programs to increase repeat business.
Table 3: Examples of Correlation Analysis Applications in Business
| Business Goal | Variables Analyzed | Potential Correlation |
|---|---|---|
| Increase Sales | Marketing Spend | Positive correlation between marketing spend and sales revenue |
| Improve Customer Loyalty | Customer Satisfaction | Positive correlation between customer satisfaction and repeat purchases |
| Optimize Product Design | Customer Feedback | Positive correlation between customer feedback and product satisfaction |
- Choose appropriate variables for analysis to ensure relevance and meaningful results.
- Use scatter plots to visualize the relationship between variables and identify any outliers.
- Calculate the correlation coefficient to quantify the strength and direction of the relationship.
- Conduct significance testing to determine if the correlation is statistically significant.
- Be cautious about interpreting correlation as causation and consider other factors that may influence the relationship.
Correlation analysis is a valuable statistical tool that provides insights into the relationship between two variables. However, it is essential to interpret correlation results cautiously and avoid inferring causation. By understanding the concepts and applications of correlation, researchers, practitioners, and businesses can leverage this technique effectively to derive meaningful conclusions from data.