Understanding the Chi-Square Test
The chi-square test is a statistical tool widely used in AP Biology to analyze categorical data and determine whether there is a significant association between two or more variables. It assesses the discrepancy between observed and expected frequencies in a sample, allowing researchers to draw conclusions about population-level relationships.

Key Concepts
- Null Hypothesis (H0): Assumes no significant association between variables.
- Alternative Hypothesis (Ha): Claims a significant association exists.
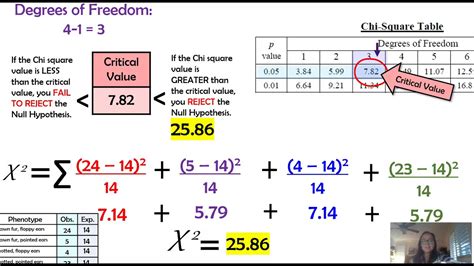
- Degrees of Freedom (df): Number of independent categories minus one.
- Chi-Square Statistic (χ^2): Calculated from the observed and expected frequencies.
- Critical Value: Determined using the chi-square distribution and the specified level of significance (α).
Assumptions of the Chi-Square Test
- Data is categorical, non-parametric.
- Expected frequencies are greater than or equal to 5 in each cell.
- Observations are independent of each other.
Step-by-Step Approach
- State the hypotheses: Specify the null and alternative hypotheses.
- Create a contingency table: Organize the observed frequencies into rows and columns.
- Calculate the expected frequencies: Multiply the row and column totals and divide by the total sample size.
- Calculate the chi-square statistic: Sum the squared differences between observed and expected frequencies, divided by the expected frequencies.
- Find the critical value: Use the chi-square distribution table with the appropriate degrees of freedom and level of significance.
- Interpret the results: Compare the chi-square statistic to the critical value. If χ^2 > critical value, reject H0 and conclude an association exists. Otherwise, fail to reject H0.
Applications in AP Biology
The chi-square test finds numerous applications in AP Biology, including:
- Independent assortment: Testing the hypothesis that traits are inherited independently.
- Dihybrid crosses: Analyzing the distribution of genotypes and phenotypes in F2 offspring.
- Hardy-Weinberg equilibrium: Determining whether the allele and genotype frequencies of a population are stable.
- Population genetics: Studying the genetic variation within a population.
- Evolutionary biology: Investigating the adaptive value of traits.
Interpreting the Results
- Significant Association: Rejecting H0 indicates a statistically significant association between the variables.
- No Significant Association: Failing to reject H0 suggests no detectable association or insufficient evidence to reject the null hypothesis.
Real-World Examples
Mendelian Inheritance: A study found that the observed frequencies of plant phenotypes fit the expected Mendelian inheritance ratios (χ^2 = 1.52, df = 2, p = 0.467). This supports the hypothesis of independent assortment.
Hardy-Weinberg Equilibrium: An analysis of allele frequencies in a fish population revealed that the observed frequencies deviated from the expected Hardy-Weinberg equilibrium (χ^2 = 12.25, df = 2, p = 0.002). This indicates a non-random mating pattern in the population.
Tables for Reference
Chi-Square Probability Distribution
| Degrees of Freedom | Critical Value (α = 0.05) |
|---|---|
| 1 | 3.841 |
| 2 | 5.991 |
| 3 | 7.815 |
| 4 | 9.488 |
| 5 | 11.070 |
Table of Observed and Expected Frequencies
| Phenotype 1 | Phenotype 2 | |
|---|---|---|
| Genotype 1 | 50 (observed) | 45 (expected) |
| Genotype 2 | 50 (observed) | 55 (expected) |
Contingency Table for Dihybrid Cross
| | Aa Bb | Aa bb | aa Bb | aa bb |
|—|—|—|—|
| PP | 125 (observed) | 130 (expected) | 130 (observed) | 125 (expected) |
| Pp | 125 (observed) | 130 (expected) | 125 (observed) | 130 (expected) |
| pp | 120 (observed) | 120 (expected) | 120 (observed) | 120 (expected) |
Table of Observed and Expected Allele Frequencies
| Allele A | Allele a | |
|---|---|---|
| Observed | 0.60 | 0.40 |
| Expected | 0.50 | 0.50 |
Conclusion
The chi-square test is a versatile statistical tool that allows AP Biology students to draw meaningful conclusions from categorical data. By understanding its assumptions, steps, and applications, researchers can employ this powerful technique to investigate various biological phenomena and support their hypotheses.