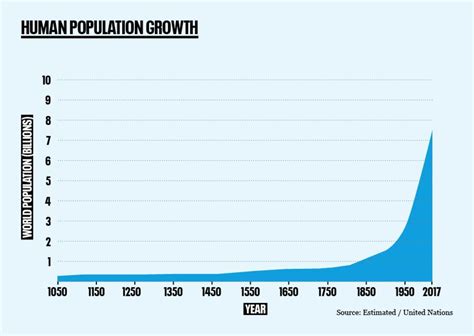
In statistics, a population refers to the entire group of individuals or objects that share certain characteristics. Understanding the concept of a population is crucial for various statistical analyses and applications.

Key Characteristics of a Population
- Comprehensiveness: A population includes all members that meet the specified criteria.
- Definability: The population is clearly defined based on observable characteristics or shared traits.
- Measurability: Data can be collected and analyzed for each member of the population.
- Representativeness: The population should be representative of the larger group being studied.
Distinguishing Populations from Samples
A population differs from a sample, which is a subset of the population selected for study. Samples are used to make inferences about the population, but they must be representative to provide accurate information.
Types of Populations
Populations can be categorized based on their characteristics:
- Finite Population: A population with a definite number of members.
- Infinite Population: A population with an indefinitely large number of members.
- Target Population: The specific population that the researcher is interested in studying.
- Accessible Population: The portion of the target population that can be reached for data collection.
Statistical Inference and Population Parameters
Statistical inference allows us to draw conclusions about a population based on sample data. Population parameters are numerical values that describe the characteristics of the population. Common parameters include:
- Mean: Average value in a population.
- Standard deviation: Measure of data spread in a population.
- Proportion: Percentage of individuals with a specific characteristic.
- Regression coefficients: Coefficients that estimate the relationship between variables in a population.
Applications of Population Data
Population data is essential for various applications, including:
- Market Research: Identifying target audience and understanding consumer behavior.
- Public Policy: Developing policies and programs based on demographic and socioeconomic data.
- Health Research: Monitoring disease prevalence, identifying risk factors, and evaluating interventions.
- Education Planning: Optimizing resources and addressing educational needs of specific populations.
Examples of Populations
- All residents of the United States
- Students enrolled in a particular university
- Patients diagnosed with a specific disease
- Customers of a particular online retailer
4 Useful Tables
| Population Type | Size | Example |
|---|---|---|
| Finite | 250 | Students in a class |
| Infinite | Indefinite | All people on earth |
| Target | 1,000 | Voters in a specific district |
| Accessible | 800 | Voters who can be contacted by phone |
| Population Parameter | Description |
|---|---|
| Mean | Average value in a population |
| Standard deviation | Measure of data spread in a population |
| Proportion | Percentage of individuals with a specific characteristic |
| Regression coefficients | Coefficients that estimate the relationship between variables in a population |
| Application of Population Data | Purpose |
|---|---|
| Market Research | Identifying target audience and understanding consumer behavior |
| Public Policy | Developing policies and programs based on demographic and socioeconomic data |
| Health Research | Monitoring disease prevalence, identifying risk factors, and evaluating interventions |
| Education Planning | Optimizing resources and addressing educational needs of specific populations |
| Pain Point | Motivation | How to Address |
|---|---|---|
| Difficulty collecting data from a large population | Use sampling techniques to select a representative subset | |
| Incomplete or inaccurate population data | Improve data collection methods and ensure data quality | |
| Difficulty interpreting population parameters | Use statistical analysis tools and consult with experts |
FAQs
-
What is the difference between a population and a sample?
A population includes all members that meet the specified criteria, while a sample is a subset of the population selected for study. -
What are the key characteristics of a population?
Comprehensiveness, definability, measurability, and representativeness. -
What are some examples of populations?
All residents of a country, patients diagnosed with a specific disease, customers of a particular business. -
What are population parameters used for?
To describe characteristics of the population and make inferences based on sample data. -
What are some applications of population data?
Market research, public policy development, health research, and education planning. -
How can population data be used to address pain points?
Use sampling techniques, improve data collection methods, and interpret data using statistical analysis tools.