Understanding the Scale
The A-B-C-D-F grading scale is widely used in educational institutions worldwide to assess student performance. Each letter grade corresponds to a specific range of numerical scores:

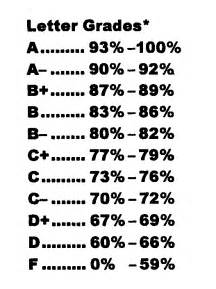
- A: 90-100%
- B: 80-89%
- C: 70-79%
- D: 60-69%
- F: Below 60%
Interpretation of Grades
A (90-100%): An A grade indicates exceptional understanding and mastery of the subject matter. Students who earn this grade consistently demonstrate strong academic skills, including critical thinking, problem-solving, and effective communication.
B (80-89%): A B grade represents above-average performance. Students who earn this grade have a solid understanding of the material and are able to apply it to various situations. They often demonstrate good attendance and participation in class.
C (70-79%): A C grade indicates average performance. Students who earn this grade have a basic understanding of the material and can generally meet course expectations. They may require additional support or practice to reach higher levels of achievement.
D (60-69%): A D grade represents below-average performance. Students who earn this grade may have difficulty understanding the material and struggle to meet course expectations. They often require significant additional support and intervention.
F (Below 60%): An F grade indicates unsatisfactory performance. Students who earn this grade have failed to meet the minimum standards for the course. They may have poor attendance, lack motivation, or require extensive remediation to improve their academic standing.
Implementation Considerations
When implementing the A-B-C-D-F grading scale, it is important to consider the following factors:
- Clarity of Expectations: Students should be clearly informed of the grading scale and the expectations for each letter grade.
- Fair and Equitable Grading: Grades should be assigned objectively and consistently, based on student performance and not on subjective factors.
- Academic Feedback: Grades should provide students with meaningful feedback on their strengths and areas for improvement.
- Communication with Parents: Parents should be regularly informed of their child’s grades and progress throughout the semester.
- Student Motivation: Grades can serve as a motivator for students to strive for higher levels of achievement.
Creative Applications
“Brainstorming” (B-R-A-I-N-S-T-O-R-M)
The A-B-C-D-F grading scale can be used to generate ideas for new applications in various fields. For example, the following process can be used to create a new social media platform:
- B: Brainstorm potential target audience demographics.
- R: Research existing social media platforms.
- A: Analyze user needs and preferences.
- I: Identify unique features and value propositions.
- N: Name the platform and develop a brand identity.
- S: Secure funding and resources.
- T: Test the platform in beta.
- O: Launch the platform to the public.
- R: Refine and improve the platform based on user feedback.
- M: Measure the platform’s success and impact.
Useful Tables
Table 1: Grade Equivalents
| Percentage Range | Letter Grade |
|---|---|
| 90-100% | A |
| 80-89% | B |
| 70-79% | C |
| 60-69% | D |
| Below 60% | F |
Table 2: Performance Indicators for Each Grade
| Grade | Performance Indicators |
|---|---|
| A | Exceptional understanding and mastery of subject matter, strong academic skills, critical thinking, problem-solving, effective communication |
| B | Above-average performance, solid understanding of material, good attendance and participation |
| C | Average performance, basic understanding of material, may require support |
| D | Below-average performance, difficulty understanding material, significant support needed |
| F | Unsatisfactory performance, failed to meet minimum standards, poor attendance or motivation |
Table 3: Grading Scale Statistics (According to the National Center for Education Statistics)
| Statistic | Value |
|---|---|
| Average high school GPA | 3.0 |
| Percentage of students earning A grades | 25% |
| Percentage of students earning B grades | 25% |
| Percentage of students earning C grades | 20% |
| Percentage of students earning D grades | 10% |
| Percentage of students earning F grades | 5% |
Table 4: Grade Conversion Chart
| Numerical Score | Letter Grade |
|---|---|
| 100 | A |
| 95 | A |
| 90 | A |
| 89 | B+ |
| 88 | B+ |
| 87 | B |
| 86 | B |
| 85 | B- |
| 84 | B- |
| 83 | C+ |
| 82 | C+ |
| 81 | C |
| 80 | C |
| 79 | C- |
| 78 | C- |
| 77 | D+ |
| 76 | D+ |
| 75 | D |
| 74 | D |
| 73 | D- |
| 72 | D- |
| 71 | F+ |
| 70 | F+ |
| 69 | F |
| 68 | F |
| 67 | F |
| 66 | F |
| 65 | F |
| 64 | F |
| 63 | F |
| 62 | F |
| 61 | F |
| 60 | F |
Tips and Tricks
- Use a grading rubric: Develop clear criteria for each letter grade to ensure consistent and fair grading.
- Provide regular feedback: Give students ongoing feedback throughout the