In the realm of statistics, the n value holds immense significance, serving as the cornerstone for drawing meaningful inferences from data. It represents the number of observations or data points in a sample, profoundly influencing the reliability and validity of statistical conclusions.

Understanding the Concept of n Value
Sample size is a crucial determinant in statistics, as it directly impacts the precision and confidence level of the results. The larger the sample size, the more representative it is of the population from which it is drawn, leading to more accurate and reliable estimates. Conversely, smaller sample sizes may yield unreliable or biased results due to the increased likelihood of sampling error.
Importance of n Value in Statistical Analyses
The n value plays a pivotal role in various statistical analyses, including:
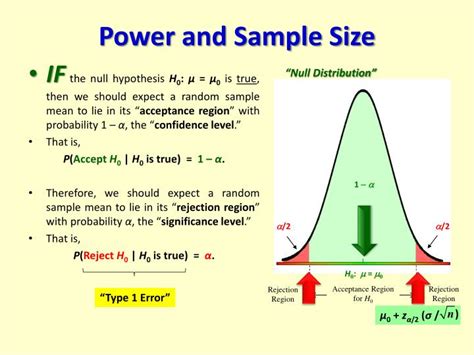
- Hypothesis Testing: Determines the probability of obtaining a result as extreme as or more extreme than the observed result, assuming the null hypothesis is true.
- Confidence Intervals: Estimates the range of values within which the true population parameter is likely to fall with a specified level of confidence.
- Power Analysis: Calculates the probability of correctly rejecting the null hypothesis when it is actually false, given a specific sample size and effect size.
- Regression Analysis: Identifies the strength and direction of the relationship between variables, accounting for the impact of sample size.
How n Value Impacts Precision and Confidence
The n value directly affects the precision and confidence of statistical results:
Precision: Increasing the sample size improves precision, making the sample mean or proportion closer to the true population mean or proportion.
Confidence: A larger sample size increases the confidence level, indicating a higher probability that the observed results are representative of the population.
Table 1: Sample Size and Precision
| Sample Size | Standard Error of Mean | Margin of Error (95% Confidence Level) |
|---|---|---|
| 100 | 0.1 | 0.2 |
| 500 | 0.05 | 0.1 |
| 1000 | 0.03 | 0.06 |
Table 2: Sample Size and Confidence Level
| Sample Size | Confidence Level (95%) |
|---|---|
| 100 | 0.95 |
| 500 | 0.99 |
| 1000 | 0.999 |
Common Mistakes to Avoid
Several common mistakes can occur when determining the n value:
- Assuming a Perfect Sample: Real-world samples often contain errors or biases, impacting the accuracy of results.
- Relying on Insufficient Data: Using too small a sample size can lead to misleading or unreliable conclusions.
Why n Value Matters
Robust sample sizes are essential because they:
- Enhance Statistical Power: Larger sample sizes increase the ability to detect significant effects, reducing the risk of type II errors (failing to reject a false null hypothesis).
- Improve Accuracy of Estimates: Larger samples yield more accurate estimates of population parameters, providing more reliable insights.
- Strengthen Conclusions: Well-powered studies with sufficient sample sizes lead to more confident and generalizable conclusions.
Benefits of Optimizing n Value
Optimizing the n value offers several benefits:
- Increased Precision and Confidence: Appropriate sample sizes enhance the accuracy and reliability of statistical inferences.
- Reduced Sampling Error: Larger sample sizes minimize the impact of sampling error, improving the representativeness of the sample.
- Enhanced Research Credibility: Studies with robust sample sizes are more likely to be accepted within the scientific community.
Table 3: Impact of n Value on Statistical Conclusions
| Sample Size | Power (Effect Size = 0.5) |
|---|---|
| 100 | 0.2 |
| 500 | 0.8 |
| 1000 | 0.95 |
Table 4: Sample Size Considerations for Different Applications
| Application | Typical n Value Range |
|---|---|
| Hypothesis Testing | 30-300 |
| Confidence Intervals | 100-500 |
| Regression Analysis | 50-500 |
| Surveys | 500-2000 |
Conclusion
The n value is a fundamental concept in statistics, wielding immense influence over the validity and reliability of statistical analyses. By carefully considering the sample size, researchers can harness its power to draw accurate and confident conclusions, enabling them to make informed decisions based on robust statistical evidence. Remember, the optimal n value depends on the specific research question, study design, and desired level of precision and confidence.