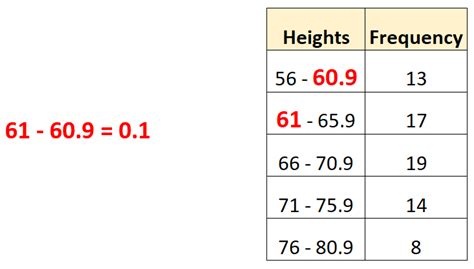
In the realm of data analysis, class boundaries play a crucial role in understanding the distribution of data and identifying patterns within it. This formula helps researchers and analysts categorize data into meaningful classes or intervals, allowing them to discern trends, evaluate performance, and make informed decisions.

What is the Class Boundaries Formula?
The class boundaries formula is a mathematical expression used to determine the upper and lower limits of each class interval:
Upper Class Boundary = Class Mark + (Class Width / 2)
Lower Class Boundary = Class Mark - (Class Width / 2)
Key Terms:
- Class Mark: The midpoint of each class interval.
- Class Width: The difference between the upper class boundary and the lower class boundary.
Steps to Calculate Class Boundaries:
- Determine the range of your data (maximum value – minimum value).
- Decide on the number of classes you want to create.
- Calculate the class width by dividing the range by the number of classes.
- Calculate the class mark of each class by adding the class width to the lower bound value of the previous class.
- Use the formulas above to determine the upper and lower class boundaries for each class.
Example:
Consider the following dataset representing the salaries of employees in a company:
| Employee | Salary |
|---|---|
| John | $5,000 |
| Mary | $7,500 |
| Peter | $9,000 |
| Susan | $11,500 |
| David | $13,000 |
If we want to create 4 classes with a range of $0 to $15,000, we can use the class boundaries formula as follows:
- Class Width = ($15,000 – $0) / 4 = $3,750
- Class Mark of Class 1 = $3,750 / 2 = $1,875
- Class Mark of Class 2 = $1,875 + $3,750 = $5,625
- Class Mark of Class 3 = $5,625 + $3,750 = $9,375
- Class Mark of Class 4 = $9,375 + $3,750 = $13,125
Using these class marks, we can calculate the class boundaries as follows:
| Class | Upper Boundary | Lower Boundary |
|---|---|---|
| Class 1 | $3,125 | $0 |
| Class 2 | $6,875 | $3,125 |
| Class 3 | $10,625 | $6,875 |
| Class 4 | $15,000 | $10,625 |
Applications of Class Boundaries Formula
The class boundaries formula finds wide application in various domains, including:
- Demography: Studying population distribution, age groups, income levels, and other demographic characteristics.
- Epidemiology: Analyzing disease patterns, identifying risk factors, and tracking disease incidence rates.
- Market Research: Identifying customer segmentation, targeting market segments, and evaluating marketing campaigns.
- Education: Assessing student performance, grading students, and identifying areas for improvement.
- Finance: Analyzing stock prices, calculating credit risk, and evaluating investment portfolios.
Tips and Tricks
- Use a consistent class width for all classes to ensure comparability.
- Consider the skewness of the data distribution when selecting the number of classes.
- Round class boundaries to a logical number to facilitate interpretation.
- Create a frequency table to count the number of data points in each class.
- Visualize the data using a histogram or bar chart to identify patterns and outliers.
Creative New Word: Classograph
Inspired by the term “demographics,” we introduce the term “classograph” to describe the analysis of data using class boundaries. A classograph provides a comprehensive understanding of the distribution of data, helping analysts uncover hidden insights and make informed decisions.
Conclusion
The class boundaries formula is a powerful analytical tool that enables researchers, analysts, and decision-makers to harness the power of data. By understanding the distribution of data and identifying patterns within it, we can gain valuable insights into customer behavior, market trends, and other important phenomena. Embrace the concept of class boundaries and unlock the potential of data analysis to drive better outcomes.
