Navigating the Many Names of the Normal Curve
The ubiquitous normal distribution, also known as the Gaussian distribution or bell curve, has earned various monikers throughout history. Its versatility and prevalence in numerous fields have led to a diverse array of names.

| Name | Origin |
|---|---|
| Gaussian distribution | After Carl Friedrich Gauss, who first described it |
| Bell curve | Due to its shape resembling a bell |
| Normal distribution | Because it is the most common distribution in nature |
| Laplace distribution | After Pierre-Simon Laplace, who independently discovered it |
| Error curve | Often used in statistics to model measurement errors |
Exploring the Applications of the Normal Distribution
The normal distribution finds widespread application in various domains due to its ability to represent a wide range of phenomena:
Physical Sciences
- Distribution of particle velocities in gases (Maxwell-Boltzmann distribution)
- Variation of random thermal fluctuations (Brownian motion)
Life Sciences
- Distribution of blood cell counts
- Variation in plant heights
Social Sciences
- Distribution of test scores
- Spread of IQ within a population
Engineering
- Modeling of measurement errors
- Reliability analysis of complex systems
Finance
- Distribution of stock returns
- Volatility prediction
The Impact of the Normal Distribution
The normal distribution has revolutionized fields by providing a framework for understanding variation and making inferences.
- Statistics: Provides a basis for hypothesis testing, confidence intervals, and regression analysis
- Probability theory: Used as a benchmark for comparing other distributions
- Quality control: Helps determine acceptable ranges for product specifications
- Risk management: Enables estimation of potential losses in financial and insurance applications
Table 2: Areas Under the Normal Curve
| z-score | Area to the Left |
|---|---|
| -3.0 | 0.0013 |
| -2.0 | 0.0228 |
| -1.0 | 0.1587 |
| 0.0 | 0.5000 |
| 1.0 | 0.8413 |
| 2.0 | 0.9772 |
| 3.0 | 0.9987 |
Unveiling the Secrets of the Curve
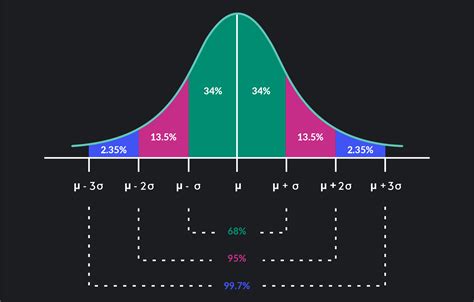
The normal distribution is characterized by a bell-shaped curve with a peak at the mean and tails extending indefinitely in both directions.
- Mean: The average value of the distribution
- Standard deviation: A measure of the spread of the data
| Property | Definition |
|---|---|
| Mean | \(\mu\) |
| Standard deviation | \(\sigma\) |
| Area under the curve | 1 (total) |
| Symmetry | Symmetric about the mean |
| Inflection points | At \(\mu \pm \sigma\) |
Table 4: Applications of the Normal Distribution in Real-World Scenarios
| Field | Application |
|---|---|
| Education | Predicting student performance on standardized tests |
| Medicine | Determining normal ranges for vital signs |
| Manufacturing | Setting quality control limits for product dimensions |
| Finance | Estimating the probability of a stock’s price exceeding a certain threshold |
FAQs: Delving into the Nuances
1. What if my data doesn’t fit a normal distribution?
The normal distribution is a model, not a universal truth. Some data may deviate from normality, requiring alternative distributions.
2. How accurate is the normal distribution?
The normal distribution is a good approximation for many phenomena. However, it can be imprecise for skewed or heavy-tailed distributions.
3. Can I use the normal distribution to predict future events?
The normal distribution provides insights into patterns and trends, but it cannot predict individual events with certainty.
4. What is the statistical significance of a deviation from normality?
Statistical tests exist to determine if a distribution significantly deviates from normality. The significance level indicates the likelihood of observing such deviations by chance.
5. How do I calculate the area under a normal curve?
The area under the normal curve can be calculated using a standard normal distribution table or statistical software.
6. What is the Central Limit Theorem?
The Central Limit Theorem states that the sum of a large number of independent random variables tends to follow a normal distribution, regardless of the original distributions.
7. What are the limitations of the normal distribution?
The normal distribution assumes that the data is continuous and follows a specific mathematical formula. It may not be suitable for categorical or discrete data.
8. What innovative applications could be explored using the normal distribution?
The “variogram” concept from geostatistics can inspire ideas for novel applications, such as predicting spatial variation in soil moisture or disease prevalence.