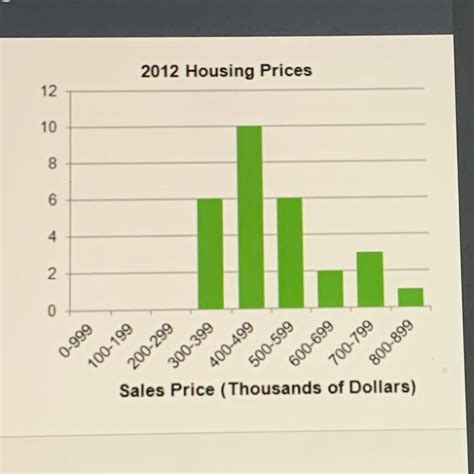
In the realm of data analysis, the shape of a graph can provide valuable insights into the underlying patterns and trends. By observing the shape of a graph, analysts can make informed decisions, identify anomalies, and uncover actionable information.

Understanding Graph Shapes
The shape of a graph refers to the overall visual representation of the data plotted on a coordinate plane. Different graph shapes correspond to specific characteristics of the data, such as its distribution, trend, and variability. Some of the most common graph shapes include:
- Linear graphs: Characterized by a straight line, linear graphs depict a proportional relationship between two variables.
- Curvilinear graphs: Exhibit a curved line, indicating a non-linear relationship between variables.
- Parabolic graphs: Resemble a parabola, representing a quadratic relationship between variables.
- Hyperbolic graphs: Feature a hyperbola-shaped curve, depicting an inverse relationship between variables.
- Exponential graphs: Show an exponential growth or decay pattern, with a curve that increases or decreases rapidly.
- Logarithmic graphs: Display a logarithmic relationship between variables, resulting in a curve that gradually increases or decreases.
Identifying the Shape of a Graph
To determine the shape of a graph, consider the following steps:
- Plot the data points: Mark the data values on a coordinate plane.
- Connect the points: Draw a line or curve that best fits the data points.
- Examine the overall trend: Observe the direction and shape of the line or curve.
- Identify the type of relationship: Based on the observed trend, classify the graph as linear, curvilinear, parabolic, hyperbolic, exponential, or logarithmic.
Applications of Graph Shapes
The shape of a graph has numerous applications in various fields:
- Data analysis: Classifying data into different shapes helps identify patterns, trends, and correlations.
- Predictive modeling: Graph shapes can be used to create models that predict future values based on historical data.
- Hypothesis testing: By analyzing the shape of a graph, researchers can determine if the data supports their hypotheses.
- Decision-making: Understanding the shape of a graph provides valuable insights for making informed decisions in business, finance, and other areas.
- Risk assessment: Graphs with specific shapes, such as exponential curves, can be used to assess potential risks and hazards.
Common Mistakes to Avoid
When analyzing the shape of a graph, avoid the following common mistakes:
- Overfitting: Forcing the data to fit a specific shape can lead to biased results.
- Underfitting: Failing to capture the true underlying pattern of the data can result in inaccurate conclusions.
- Misinterpreting the trend: Not considering the context and limitations of the data can lead to faulty interpretations.
- Ignoring outliers: Exceptional data points can significantly impact the shape of a graph. It’s crucial to consider their influence.
- Using inappropriate scales: Choosing inappropriate axes scales can distort the true shape of the graph.
How to Analyze Graph Shapes
To accurately analyze the shape of a graph, follow these steps:
- Gather data: Collect relevant data and prepare it for graphing.
- Plot the graph: Create a scatter plot or line graph using the data points.
- Identify the shape: Observe the overall trend and classify the shape based on the criteria discussed earlier.
- Interpret the shape: Consider the implications of the graph shape and its relationship to the variables involved.
- Draw conclusions: Based on the analysis, draw informed conclusions about the data and its underlying patterns.
Example Graph Shapes
1. Linear Graph: A linear graph of sales revenue over time might show a steady, proportional increase in revenue.
2. Curvilinear Graph: A curvilinear graph of consumer satisfaction with product features might display a bell-shaped curve, indicating an optimal level of features.
3. Parabolic Graph: A parabolic graph of projectile motion might represent the path of an object thrown upward, with a vertex at the highest point.
4. Hyperbolic Graph: A hyperbolic graph of the relationship between price and quantity demanded might depict an inverse relationship, where a higher price leads to lower demand.
5. Exponential Graph: An exponential graph of population growth might show a rapid increase in population over time, with a steep upward curve.
6. Logarithmic Graph: A logarithmic graph of a company’s stock price over time might display a gradual increase, with a curve that flattens over time.
Innovation and New Applications
By leveraging the concept of graph shapes, businesses and researchers can unlock new insights and applications:
- Trendspotting: Graph shape analysis can identify emerging trends and patterns, enabling proactive decision-making.
- Anomaly detection: Graphs with unusual shapes can flag outliers and anomalies, allowing for early detection and mitigation.
- Data harmonization: Graphs can help harmonize data from different sources, making it easier to compare and analyze disparate datasets.
- Knowledge graphs: Graphs with complex shapes can be constructed as knowledge graphs to represent interconnected concepts and relationships.
- Data visualization: Graph shapes can be used to create innovative and visually appealing data visualizations that convey insights effectively.
Conclusion
The shape of a graph provides a powerful tool for understanding data patterns and making informed decisions. By understanding the different types of graph shapes and their implications, analysts and researchers can unlock valuable insights, identify anomalies, and make data-driven decisions across a wide range of applications. The key lies in accurately analyzing graph shapes, avoiding common mistakes, and leveraging innovation to uncover new possibilities and applications.
