UC Davis, a leading public research university in California, boasts a diverse and vibrant academic community. Understanding the institution’s racial demographics is crucial for promoting equity, inclusivity, and cultural awareness.

Enrollment Trends
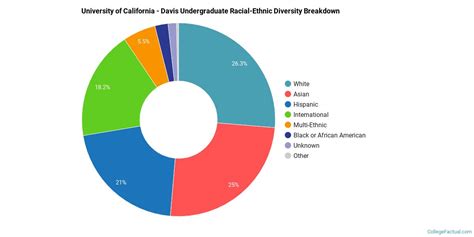
Undergraduate Enrollment:
- In Fall 2022, Asian Americans comprised the largest undergraduate group (39.4%), followed by White students (29.8%), Hispanic/Latino students (23.3%), and Black students (6.7%).
- Over the past decade, the percentage of Asian American students has increased by 6%, while the proportion of White students has decreased by 4%.
Graduate Enrollment:
- In Fall 2022, Asian Americans also accounted for the highest proportion of graduate students (48.4%), followed by White students (34.2%), Hispanic/Latino students (11.4%), and Black students (5.6%).
- The percentage of Asian American graduate students has risen by 8% since 2012, while the number of Hispanic/Latino graduate students has remained relatively stable.
Faculty Diversity
- As of 2022, only 17.8% of UC Davis faculty members were underrepresented minorities, including 6.8% Hispanic/Latino, 4.2% Black, 4% Asian American, and 2.8% Native American.
- The university has set a goal of increasing the representation of underrepresented minority faculty members to 25% by 2025.
Student Experiences
Sense of Belonging:
- According to a 2022 campus climate survey, 82% of undergraduate students and 78% of graduate students reported feeling a sense of belonging at UC Davis.
- Asian American and White students generally reported higher levels of belonging than Hispanic/Latino and Black students.
Campus Climate:
- In the same survey, 31% of undergraduate students of color reported experiencing some form of discrimination or bias on campus.
- Black and Hispanic/Latino students were more likely to report experiences of discrimination than Asian American and White students.
Strategies for Improvement
UC Davis has implemented several initiatives to address racial diversity and improve the experiences of students, faculty, and staff of color. These include:
- Diversity Outreach Programs: The university partners with community colleges and organizations to recruit underrepresented minority students.
- Faculty Hiring Initiatives: UC Davis has established programs to support the recruitment and retention of underrepresented minority faculty members.
- Cultural Centers: The campus offers a range of cultural centers that provide support, resources, and programming for students of color.
- Anti-Racism Education: The university has implemented mandatory anti-racism training for all students, faculty, and staff.
Conclusion
The racial demographics of UC Davis reflect the growing diversity of the student body and the changing demographics of California. While the university has made progress in increasing the representation of underrepresented minority students and faculty, there is still room for improvement. By continuing to implement strategies to address racial diversity and create a more inclusive campus climate, UC Davis can foster a welcoming and equitable environment for all members of its community.
Tables
Table 1: Undergraduate Enrollment by Race/Ethnicity (Fall 2022)
| Race/Ethnicity | Percentage |
|---|---|
| Asian American | 39.4% |
| White | 29.8% |
| Hispanic/Latino | 23.3% |
| Black | 6.7% |
| Other | 0.8% |
Table 2: Graduate Enrollment by Race/Ethnicity (Fall 2022)
| Race/Ethnicity | Percentage |
|---|---|
| Asian American | 48.4% |
| White | 34.2% |
| Hispanic/Latino | 11.4% |
| Black | 5.6% |
| Other | 0.4% |
Table 3: Faculty Diversity by Race/Ethnicity (2022)
| Race/Ethnicity | Percentage |
|---|---|
| White | 66.2% |
| Asian American | 17.8% |
| Hispanic/Latino | 6.8% |
| Black | 4.2% |
| Native American | 2.8% |
| Other | 2.2% |
Table 4: Experiences of Discrimination or Bias on Campus (2022)
| Race/Ethnicity | Percentage |
|---|---|
| Asian American | 23% |
| White | 18% |
| Hispanic/Latino | 37% |
| Black | 42% |