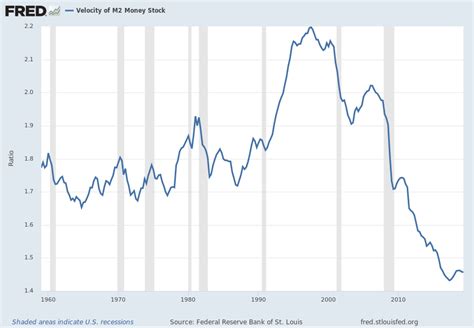
The velocity of money, a key macroeconomic indicator, measures the rate at which money circulates within an economy. Understanding the velocity of money is crucial for central banks and policymakers to guide monetary policy effectively. This in-depth guide will explore the concepts, importance, and applications of the velocity of money graph.

Key Concepts:
The velocity of money (V) is defined as the ratio of nominal gross domestic product (GDP) to the money supply (M):
V = GDP / M
The monetary supply refers to the total amount of money in circulation, including physical currency, demand deposits, and other liquid assets. GDP, on the other hand, represents the total value of goods and services produced domestically during a specific period.
Importance of Velocity of Money:
The velocity of money provides valuable insights into economic activity and the effectiveness of monetary policy:
- Economic growth: A high velocity of money indicates that money is circulating rapidly, facilitating economic expansion. Conversely, a low velocity may suggest sluggish economic growth.
- Inflation: A rapid increase in the velocity of money can lead to inflationary pressures, as more money chases after a limited supply of goods and services.
- Monetary policy: Central banks use the velocity of money to assess the impact of monetary policy changes. A rise in velocity may prompt the central bank to tighten monetary policy, while a decline may suggest expansionary measures.
Types of Velocity of Money:
There are various types of velocity of money, each with its own significance:
- Transaction velocity: Measures the number of times physical currency is exchanged for goods and services.
- Income velocity: Indicates how often money in circulation is used to purchase income-generating assets.
- Output velocity: Relates to the frequency with which money is used to buy newly produced goods and services.
Velocity of Money Graph:
The velocity of money graph plots the relationship between the velocity of money and time. It provides a visual representation of the historical pattern of how quickly money circulates within an economy.
[Image of Velocity of Money Graph]
The graph can exhibit various trends:
- Stable velocity: A relatively constant velocity indicates a stable economic environment where money circulates at a predictable rate.
- Increasing velocity: A rising velocity may signal economic growth, inflation, or a shift towards digital payments.
- Decreasing velocity: A declining velocity could suggest economic slowdown, deflation, or increased demand for speculative assets.
Factors Influencing Velocity of Money:
Numerous factors can influence the velocity of money, including:
- Economic growth: Economic expansion generally leads to a higher velocity as money circulates more rapidly.
- Inflation: Higher inflation tends to increase the velocity of money as people spend money faster to avoid losing its value.
- Interest rates: Low interest rates encourage borrowing and spending, which can increase the velocity of money.
- Technology: Digital payment systems and mobile wallets have accelerated money circulation, potentially boosting velocity.
- Consumer behavior: Changes in consumer spending patterns, such as increased saving or online shopping, can impact velocity.
Applications of Velocity of Money Graph:
The velocity of money graph finds various applications in economics and finance:
- Monetary policy: Central banks use the velocity of money graph to gauge the effectiveness of monetary policy changes.
- Economic forecasting: Economists analyze the graph to forecast economic trends, identify potential risks, and make informed policy decisions.
- Financial analysis: Investors use the velocity of money to assess the market outlook and identify investment opportunities.
- Cross-country comparisons: The velocity of money graph enables comparisons of economic performance across countries.
Real-World Examples:
The velocity of money graph has been used extensively in economic research and policymaking. For example:
- In the United States, the velocity of money has been declining since the 1980s, reflecting factors such as technological advancements and increased saving.
- In Japan, the velocity of money has remained relatively low during the past decade, contributing to concerns about deflation and economic stagnation.
- In emerging markets, the velocity of money has often been higher, signaling rapid economic growth and inflation.
Pain Points and Motivations:
Pain points:
- Lack of understanding of the velocity of money concept.
- Difficulty in accurately measuring the monetary supply.
- Limited availability of historical data on velocity of money.
Motivations:
- Desire to understand economic trends and fluctuations.
- Need to make informed investment decisions.
- Interest in tracking the effectiveness of monetary policy.
Common Mistakes to Avoid:
- Confusing velocity of money with inflation: Velocity of money measures the speed of money circulation, whereas inflation refers to the rate of price increases.
- Using outdated data: Velocity of money data can become outdated quickly, so it’s crucial to use the most recent information.
- Misinterpreting trends: It’s essential to analyze the velocity of money graph in context, considering other economic data and factors.
Conclusion:
The velocity of money graph is a powerful tool for understanding economic activity, evaluating monetary policy, and making informed investment decisions. By leveraging this metric, policymakers, economists, and investors can better navigate the complexities of the economy and identify opportunities for growth and prosperity.


