Introduction
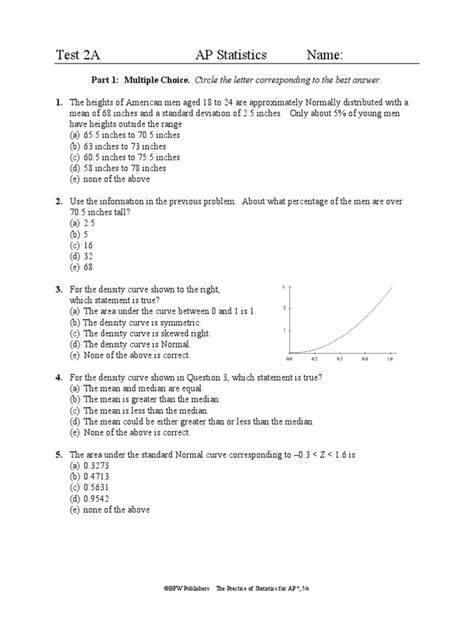
In the realm of statistics, exploratory data analysis (EDA) is the cornerstone of understanding and summarizing data. Chapter 2 of the College Board’s AP Statistics curriculum delves into this crucial concept, providing students with a toolkit for exploring, visualizing, and summarizing data. This AP quiz is designed to assess your comprehension of the key principles and methods covered in Chapter 2.

Understanding Exploratory Data Analysis
EDA is a process of examining data to uncover patterns, identify outliers, and gain insights into the underlying structure. By applying statistical techniques and graphical representations, EDA empowers researchers to make informed decisions about further analysis and interpretation.
Key Components of EDA
- Data Transformation: Preparing data for analysis by addressing missing values, outliers, and non-linear relationships.
- Graphical Representation: Visualizing data using histograms, scatterplots, box plots, and other graphical tools.
- Numerical Measures: Calculating summary statistics such as mean, median, standard deviation, and quartiles to quantify key characteristics of data.
Graphical Representation of Data
Histograms:
Histograms divide the data into equal intervals (bins) and display the frequency or proportion of data points within each bin. They provide a visual representation of the distribution of data, revealing patterns like skewness and multimodal distributions.
Scatterplots:
Scatterplots depict the relationship between two quantitative variables, with each data point represented by a point on the graph. Scatterplots reveal linear or non-linear trends, outliers, and the strength of the correlation between variables.
Box Plots:
Box plots summarize the distribution of data by dividing it into quartiles (Q1, Q2, and Q3) and displaying the median (Q2), range (distance between Q1 and Q3), and outliers. Box plots provide a quick overview of data variability and asymmetry.
Numerical Measures of Data
Mean, Median, and Mode:
- Mean (Average): The sum of all data points divided by the number of observations. It is sensitive to outliers.
- Median: The middle value when data is arranged in order. It represents the midpoint of the data and is less affected by outliers.
- Mode: The value that occurs most frequently in the data.
Standard Deviation and Interquartile Range:
- Standard Deviation: A measure of data variability, representing the average distance of data points from the mean. A larger standard deviation indicates greater spread.
- Interquartile Range (IQR): The difference between the third quartile (Q3) and the first quartile (Q1). It represents the spread of the middle 50% of the data.
Applying EDA to Real-World Scenarios
The principles of EDA are indispensable in various fields of study. For instance, in medical research, exploratory analysis of patient data can reveal patterns of disease incidence, treatment effectiveness, and risk factors. Similarly, in financial analysis, EDA of stock prices helps identify trends, predict future values, and make investment decisions.
Sample Questions
Question 1:
Which graphical representation is most appropriate for examining the distribution of a quantitative variable?
A) Scatterplot
B) Histogram
C) Box plot
D) Pie chart
Question 2:
What is the difference between the mean and median of a data set?
A) The mean is always greater than the median.
B) The median is always greater than or equal to the mean.
C) The mean and median are always equal.
D) The mean can be greater or less than the median, depending on the data.
Question 3:
A researcher wants to describe the relationship between age and blood pressure. Which type of graphical representation would be most useful?
A) Histogram
B) Scatterplot
C) Box plot
D) Pie chart
Additional Practice Resources
- Khan Academy AP Stats: Chapter 2
- College Board AP Statistics Practice Test
- Stat Trek Tutorial on Exploratory Data Analysis
Conclusion
Mastering the concepts and techniques of Chapter 2 AP Stats AP quiz is crucial for succeeding in the AP Statistics exam and beyond. By understanding the principles of exploratory data analysis, you will be equipped to explore, visualize, and summarize data in meaningful ways. This knowledge empowers researchers, analysts, and decision-makers to make informed judgments and gain actionable insights from data. Embrace the power of EDA and unlock the secrets of your data!
Frequently Asked Questions
Q1: What is the main purpose of exploratory data analysis?
A1: Exploratory Data Analysis is used to gain an understanding of the data by exploring patterns, identifying outliers, and summarizing key characteristics.
Q2: What benefits do I gain from learning exploratory data analysis?
A2: By learning EDA, you will be able to visualize data effectively, calculate and interpret numerical measures, and develop a deeper understanding of the structure and relationships within your data.
Q3: What types of data can be analyzed using EDA techniques?
A3: EDA techniques can be applied to any type of data, whether it is quantitative or qualitative, structured or unstructured.
Q4: How can I apply EDA in my own projects or research?
A4: EDA techniques can be used in a variety of projects, from analyzing customer survey data to evaluating the effectiveness of marketing campaigns. By applying EDA, you can gain insights and make informed decisions based on your data.
Q5: What is the relationship between EDA and inferential statistics?
A5: Exploratory data analysis provides a foundation for inferential statistics. By exploring your data first, you can make more informed decisions about which statistical tests to use and how to interpret your results.
Q6: How can I improve my skills in exploratory data analysis?
A6: To improve your EDA skills, practice using different graphical representations, calculating numerical measures, and interpreting data patterns. You can also work with real-world datasets to gain hands-on experience.
Q7: What are some of the challenges in applying EDA?
A7: Some challenges in applying EDA include identifying the appropriate graphical representations, choosing the right numerical measures, and handling missing or corrupted data.
Q8: How can I stay updated on the latest advancements in EDA?
A8: To stay updated on the latest advancements in EDA, consider reading research papers, attending conferences, or taking online courses on data analysis and visualization.
